Our premium members receive a weekly report of exchange-traded funds (ETFs) appropriate for covered call writing. These lists will never include a leveraged ETF because we feel that these securities are too risky and suitable only for sophisticated investors with high risk-tolerance. In this article, I will break down the mechanics of how leveraged ETFs work and demonstrate why it is not suitable for many retail investors.
Leveraged ETFs use a series of investment strategies such as short-selling, purchasing put options and using futures contracts to magnify the performance of the index that the ETF is tracking. They are constructed to return 2x or 3x of the underlying index value. As an example, if an index is up 1% in a day, that leveraged ETF would be expected to rise by 2% or 3%that day. Many use the term Ultra in their names.
Daily re-balancing and long-term results
Fund managers are driven to trade derivative securities such that at the end of a trading day the fund meets its advertised performance. Because of this daily re-balancing of the funds, the long-term results may not be the same as its advertised objectives. As long as the index increases in value the stated leverage will be met. However, if the index drops in value, the leveraged ETF will be worse off than the expected value based on its stated objective. Let’s set up an example to explain these concepts:
- Ultra BCI is a leveraged ETF with the objective of generating 2x the returns of index XYZ
- Share value = $20
- Index value = $1000
- On day 1 the index rises 10% to 1100
- Ultra BCI rises 20% to $24
- On day 2 the index drops back to 1000, a decline of 9.09% (100/1100)
- Ultra BCI drops by 18.18%($4.36) to $19.64
- While there was no change in the index after 2 days, there was a 1.8% decline in share value
QLD: leveraged ETF looking to return 2x that of QQQ (Nasdaq 100):
To further demonstrate how the funds leveraged objective does not usually hold true long-term, let’s view a 5-year comparison chart of QQQ (black line) versus its leveraged partner QLD (2x) (blue line):
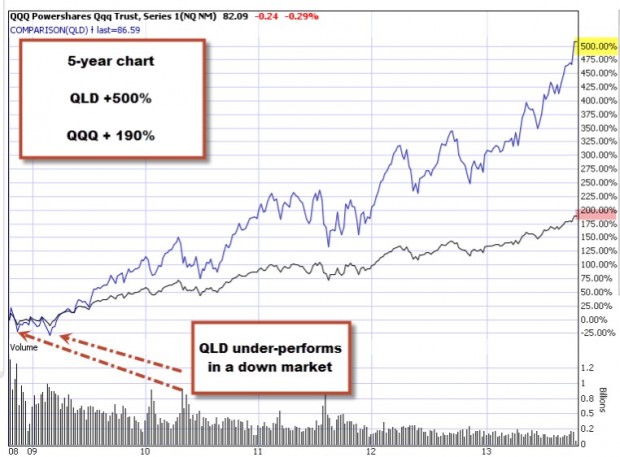
QLD vs. QQQ
Note how QLD performed much better than its stated 2-to-1 objective long-term as QQQ rose precipitously over the past 5 years.
Tax implications:
Because of the nature of the derivatives employed to reach the funds daily stated objectives, investors are subject to a complicated set of tax rules and therefore are not as tax efficient as standard ETFs.
Conclusion:
Leveraged ETFs are not appropriate for most retail investors because of the risk and high volatility. It is particularly inappropriate (in the eyes of this investor) for conservative investors utilizing a conservative strategy like covered call writing. For sophisticated investors with high risk tolerance this may be a useful security to use.
***For information on how to become a premium member and access our weekly ETF and stock reports:
https://www.thebluecollarinvestor.com/membership/
Next live seminar:
Chicago: Saturday November 9, 2013
http://www.aaii.com/chapters/info?ChapterID=1
DePaul University Center
8th Floor
Room 8005
DISCOUNT COUPON FOR MY 4TH BOOK:
I am humbled by your response to my latest book, Stock Investing For Students. Based on the orders we have received during the 1st week of its release many of you are planning to give multiple copies to friends and family. Lots of parents and grandparents in the BCI community! This is exactly what I was hoping for…to get as many young people to start elevating the level of their financial literacy. Thank you so much. This is the last week of our early-order discount offer and I want to be sure that if you plan to purchase this book or several copies that you take advantage of this offer. Here is that promo code to enter with your order to receive a 10% discount @ checkout:
SISDISCOUNT
For your convenience, here is the link:
https://www.thebluecollarinvestor.com/stock-investing-for-students/
Premium members please use the promo code that was previously mailed to you.
Market tone:
As has been the pattern since this site went bullish on the market in the 2nd quarter, 2009, the weekly economic reports were mixed to positive. Here is a summary of this week’s reports:
- The Federal Reserve’s Federal Open Market Committee (FOMC) decided not to ease it policy of buying $85 billion a month in bonds in order to decrease long-term interest rates
- The Fed also reiterated its plan to keep short-term interest rates near zero citing a slowing in the housing market as one main reason
- According to the Institute of Supply Management (ISM) the ISM manufacturing index rose to 56.4, better than the 55.0 expected
- New manufacturing orders remained above 60, a bullish stat for our economy
- New export orders also increased indicating a strengthening of economies in China and Europe
- The nation’s industrial output from mining, manufacturing and utility plants, increased by 0.6% in September , above the 0.4% anticipated
- Retail sales decreased by 0.1% in September, below the + 0.1% expected. This was mostly due to the decline in auto sales
- Excluding autos, retail sales actually increased by 0.4%
- The Conference Board’s consumer confidence index dropped to 71.2 in October, below the 75.3 expected
- Inflation remains in check as the Producer price Index (PPI) fell 0.1% in September while analysts were expecting a rise of 0.2%. This was due mainly to a decline in food prices
- Compared to one year ago, PPI decelerated by 0.3% in September from 1.4% in August
- The Consumer Price Index (CPI) rose by 0.2% in September partially due to rising energy prices
- Compared to a year ago, consumer inflation decelerated to 1.2% in September from 1.5% in August
- The Social Security Administration declared that benefits which are tied to inflation would rise by only 1.5% in 2014
For the week, the S&P 500 rose by 0.1% for a year-to-date return of 26%, including dividends.
I’ve had numerous inquiries in the past few weeks from new members asking how I assess market tone. As stated in my books and DVDs, I use three resources: Chart analysis of the S&P 500 as well as of the CBOE Volatility Index (VIX). In addition to those factors, I carefully evaluate the economic reports on a weekly basis…the ones I outline for you each week in my blog articles. Here is a 5-year chart showing a rising overall market and a calming and declining VIX over that time frame:
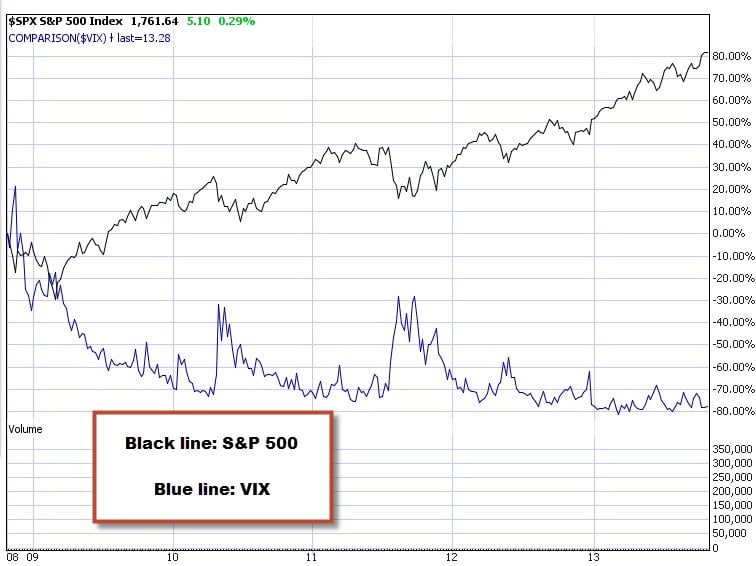
5-year chart of S&P 500 and the VIX
Summary:
IBD: Confirmed uptrend
BCI: Moderately bullish favoring out-of-the-money strikes 2-to-1
Thanking you for your continuing support,
Alan (alan@thebluecollarinvestor.com)
I highly recommend this video:
Whether you subsribe to the BCI methodology for covered call writing or follow the retirement plan in my latest book or use other resources to understand and master investment strategies, we all must be educated. Education is power and it has never been framed better than in this PBS Program video:
http://www.pbs.org/wgbh/pages/frontline/retirement-gamble/
It is 52 minutes long but time well spent in my view.
Thanks to Peter S for sharing this video with me so I can share it with you.
Alan
Premium Members,
Due to inaccurate data received from IBD last night and planned IBD maintenance downtime on their website over this weekend, the Premium Report will be delayed this week. At this time, we do not have an estimate of when the report will be available, but we will get it out as soon as possible.
We are sorry for the delay.
Best,
Barry and the BCI Team
Premium Members,
This week’s Weekly Stock Screen And Watch List has been uploaded to The Blue Collar Investor premium member site and is available for download in the “Reports” section. Look for the report dated 11-01-13-B.
Also, be sure to check out the latest BCI Training Videos and “Ask Alan” segments. You can view them at The Blue Collar YouTube Channel. For your convenience, the link to the BCI YouTube Channel is:
http://www.youtube.com/user/BlueCollarInvestor
Since we are in Earnings Season, be sure to read Alan’s article, “Constructing Your Covered Call Portfolio During Earnings Season”. You can access it at:
https://www.thebluecollarinvestor.com/constructing-your-covered-call-portfolio-during-earnings-season/
Best,
Barry and The BCI Team