Treasury bond yields are followed by stock investors and changes in yield can impact the success of our trades. In particular, the 10-year treasury yield is used as a yardstick for critical financial issues like mortgages.
What is bond yield?
This is the interest rate paid by the US government for borrowing money when bonds are sold. Bonds are issued with a face value and a fixed interest rate and sold at initial auction or on the secondary market to the highest bidder. The 10-year Treasury note is a benchmark that guides other interest rates.
Investor confidence is reflected in Treasury yields
Confidence high: Bond prices will decline, and yields move higher as investors will favor alternative investments that offer higher investment returns despite the higher risk.
Confidence low: Bond prices move up as demand increases and, as a result, yields move down. Investors are seeking safe investments and settling for lower potential returns.
The 3% threshold
In August 2018, there was market concern as the 10-year Treasury yield approached 3% . This was more a psychological barrier than a realistic one since rates were still historically low. Bears point out that rising rates negatively impact the debt-servicing costs for corporations. Bulls argue that strong earnings growth and a stable economy can support modest rate hikes.
Rising rates and the S&P 500
The theory that rising rates will cause a decline in the stock market is not confirmed by historical data. Overall, stocks tend to perform well during periods of rising rates:
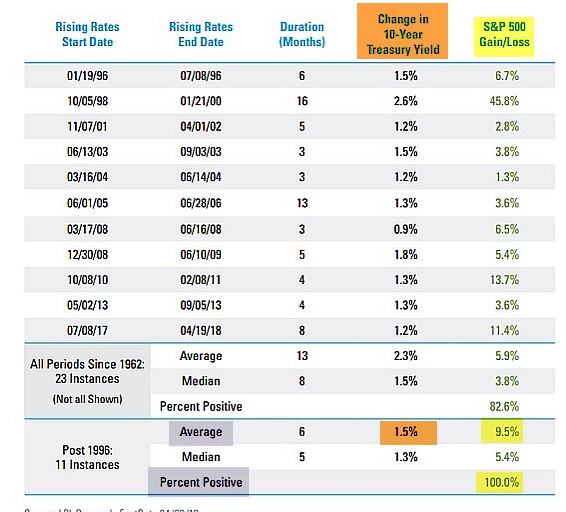
Treasury Rates and the S&P 500 (Chart by LPL Financial)
During periods of rising rates (brown fields), the average rise was 1.5%. The average change in the S&P 500 during those time frames averaged to 9.5% (yellow fields) There was a positive correlation 100% of the time. This positive correlation seems to break down when rates approach 5%.
Chart of 10-year Treasury Bond yields
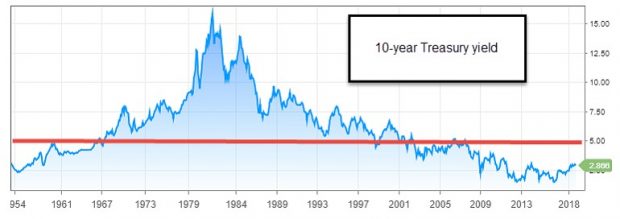
10-Year Treasury Bond Yields
The red line in the chart shows the 5% threshold.

10-Year Bond Yield vs. S&P 500
When interest rates for the 10-year Treasury (blue line) rises above 5%, market (green line) decline is more of a factor as highlighted with the red arrows.
Discussion
The 10-year Treasury Bond yield is a key market indicator. Historical data shows that the stock market will not be negatively impacted as long as rates remain historically low.
March 8th stock report
*** PLEASE NOTE: The stock report for the week ending March 8th will be published on Monday March 11th, later than usual due to vacation and travel plans. Every effort will be made to post this report as early as possible.
Upcoming events
March 29th
Quinnipiac GAME Forum
International forum for college and graduate school finance majors
May 8th
Alan will be hosting a free webinar for the Options Industry Council (OIC) on generating income from selling options. More information to follow.
May 14th
Las Vegas Money Show
Bally’s/ Paris Hotel
12:15 – 3:15
Master class encompassing covered call writing, put-selling and the stock repair strategy
This is a paid event hosted by The Money Show
Your generous testimonials
Over the years, the BCI community has been incredibly gracious by sending our BCI team email testimonials sharing stories as to what our educational content has meant to their families. Moving forward, we have decided to share some of these testimonials in our blog articles. We will never use a last name unless given permission:
Alan,
I started employing the covered call writing strategy you teach in the 2nd quarter of last year. I have already realized some nice returns by employing this strategy. I finished 2018 ay 4.6% on my main IRA. I thought that was decent compared to the S&P being down 6-7%.
Thanks for all you do for all of us do-it-your-selfers!
Greg
Market tone
This week’s economic news of importance:
- Home builders index Feb. 62 (58 last)
- Weekly jobless claims 2/16 216,000 (229,000 expected)
- Durable goods orders Dec. 1.2% (1.4% expected)
- Philly Fed Feb. -4.1 (17.0 last)
- Markit manufacturing PMI Feb. 53.7 (54.9 last)
- Markit services PMI Feb. 56.2 (54.2 last)
- Existing home sales Jan. 4.94 million (4.99 million last)
- Leading economic indicators Jan. -0.1% (0.0% last)
THE WEEK AHEAD
Mon Feb. 25th
- Chicago Fed national activity index
- Wholesale inventories Dec.
Tue Feb. 26th
- Housing starts Dec.
- Building permits Dec.
- Case-Shiller price index Dec.
- Consumer confidence index Feb.
- New home sales Jan.
Wed Feb 27th
- Durable goods orders Jan.
- Pending home sales index Jan.
- Factory orders Dec.
Thu Feb 28th
- Weekly jobless claims 2/23
- GDP Q4
- Chicago PMI Feb.
- Personal income Dec. and Jan.
- Consumer spending Dec. and Jan.
- Core inflation Dec. and Jan.
- Markit manufacturing Feb.
- ISM manufacturing index Feb.
- Construction spending Jan.
- Consumer sentiment index Feb.
Fri March 1st
- None scheduled
For the week, the S&P 500 moved up 0.62% for a year-to-date return of 11.40%
Summary
IBD: Market in confirmed uptrend
GMI: 6/6- Bullish signal since market close of January 31, 2019
BCI: I am favoring out-of-the-money strikes 2-to-1 compared to in-the-money strikes.
WHAT THE BROAD MARKET INDICATORS (S&P 500 AND VIX) ARE TELLING US
The 6-month charts point to a greatly improving market tone. In the past six months, the S&P 500 down 2% while the VIX (13.51) moved up by 9%.
Wishing you the best in investing,
Alan and the BCI team

Alan I am having a recurring problem. Yesterday I bought NSP March 15 120 call ITM up + $260
I sold the March 15 125 call ITM and have a -$230 value.
Should I be using an April expiration to prevent this. I am experiencing this quite frequently. How do I prevent this?
Stock is rising in value and Delta. The sold to open is increasing in Delta creating my negative value. I know I am missing something, not sure what it is.
Your advice please!
Harry
Harry,
First, kudos to you for your due-diligence to manage trades to the highest possible levels.
Next, let me congratulate you on a successful trade (to date). That may be what you’re missing?
When we sell an ITM strike, our maximum return is the time value component of the original option premium. As stock price rises, that max return looks better and better. This is success based on the initial structuring of the trade.
Now, this does not mean that we can’t generate even more income and although option Delta and premium is rising, the time value component of that premium is falling. As that time value approaches zero, we can initiate the mid-contract unwind exit strategy to establish a second income stream in the same month with the same cash and a new stock. Rolling considerations with an accelerating stock price comes near contract expiration.
For more information on the mid-contract unwind exit strategy:
Complete Encyclopedia-Classic: Pages 264 – 271
https://www.thebluecollarinvestor.com/alan-ellmans-complete-encyclopedia-for-covered-call-writing-scover/
Complete Encyclopedia- Volume 2: Pages 243 – 252
https://www.thebluecollarinvestor.com/alan-ellmans-complete-encyclopedia-for-covered-call-writing-volume-2/
Alan
Alan I am reviewing your information. I am using the Complete Encyclopedia for Covered Call Writing pages 286 and 287. In this example you bought the call for LULULEMON in July. Now you reviewed August 38 strike to sell the $38 option. Normally I would have sold the July 38 strike at a lower Delta. Did not realize I could go out a month to choose my sell option for LULULEMON.
Harry,
The example you are referencing is found in the “exit strategy” chapter of the Encyclopedia. Pages 286 – 287 refers to “rolling out” from the July $38 call to the August $38 call as expiration approaches. Rolling up in the July contracts is not a consideration.
Page 288 shows a spreadsheet for rolling out and up as well.
Alan
I was doing portfolio overwriting on UPS and sold $110 call expiring 03/08. UPS closed this Friday at $110.36 (slightly ITM). Ex-dividend date is scheduled on Monday, 02/25. The dividend is $0.96. The bid/ask price is $1.18/$1.31. I don’t see my shares called yet, but don’t understand how to calculate is it any rationale for option holder to exercise his option to capture the dividend.
Thanks!
Sunny,
Early exercise to capture a dividend will occur when retail investors make an error and the exercise notice randomly lands in our account. it is rare but possible.
When an option holder exercises an ITM strike, intrinsic value is gained ($0.36 in this case) but time value ($0.82 in this case given a sale price of $1.18) is lost.
Instead, the option holder can sell the option and buy the stock and still capture the $0.96 dividend as long as shares were purchased prior to the ex-date.
Alan
Premium Members,
This week’s Weekly Stock Screen And Watch List has been uploaded to The Blue Collar Investor premium member site and is available for download in the “Reports” section. Look for the report dated 02/22/19.
Also, be sure to check out the latest BCI Training Videos and “Ask Alan” segments. You can view them at The Blue Collar YouTube Channel. For your convenience, the link to the BCI YouTube Channel is:
http://www.youtube.com/user/BlueCollarInvestor
Since we are in Earnings Season, be sure to read Alan’s article, “Constructing Your Covered Call Portfolio During Earnings Season”. You can access it at:
https://www.thebluecollarinvestor.com/constructing-your-covered-call-portfolio-during-earnings-season/
*** PLEASE NOTE: The stock report for the week ending March 8th will be published on Monday, March 11th, later than usual due to vacation and travel plans. Every effort will be made to post this report as early as possible.
Best,
Barry and The Blue Collar Investor Team
barry@thebluecollarinvestor.com
Alan,
I have been struggling with finding options from your list that will produce a 3 to 4% projected ROO based on the awesome calculator from BCI below. (3 to 4% being what BCI states is possible when you get good at this option trading). Trade date for the Options below in Green was Friday 2/22/19 between 12:00 and 3:30 PM. Today I went back and looked at trades I could have performed (shown in blue) that were out of the money with the possibility of greater returns with the stock moving up. Had I picked some of these for the remaining 21 days to Mar 15, I may have increased my ROO but would have had a lower initial ROO.
The weekly news letter for BCI says that BCI is buying at 2 to 1 out of the money. Can you discuss that in more detail. (I’m a beginner with BCI) If BCI is buying 3 lots, are two out of the money and one in the money for each position. I expect that a more detailed approach is being used. I like to look at the action of the stock prior to buying, i.e., going up, down, sidewise, resistance from prior highs and of related volume action. I could see myself in the future using that as a weighting factor for how many options are purchased out of the money vs in the money.
For equal weighted portfolio the purchased options have a starting ROO of 2.8% and a maximum profit of 3.0 (when upside potential included)
For equal weighted portfolio the Out of the money selection has a maximum profit of 5.2% (with the upside potential included)
and if one had purchased at 2 to 1 out of the money the maximum profit would have been 4.5%
After all that I likely answered part of my own question (and I could make 3% ROO with the upside, which could project out to be an amazing 36% return for the year ). I would still like to hear BCI’s take on how to use a 2 to 1 out of the money position.
thanks
Mark
CLICK ON MARK’SIMAGE TO ENLARGE & USE THE BACK ARROW TO RETURN TO BLOG.
Hi Mark,
My only two cents is never confuse options selling for either income or portfolio gain. It all depends on the under lying and how you manage them.
Like the Chief in Little Big Man said as he laid down to die in the rain but did not: “Some times the magic works and some times it doesn;t” – Jay
Mark,
Let me first clarify the BCI guidelines for initial time value return:
Each investor must set these guidelines based on their personal risk tolerance. I consider myself a conservative investor willing to expose my portfolio to modest risk (the risk is in the stock, not in the sale of the option). A reasonable initial time value return goal for me is 2% – 4% (I use an extremely conservative 1% – 2% in my mother’s portfolio). I use 1-month expirations. Once our positions are entered, we move into [position management mode for both the short calls and long stock positions. On 2/22, we have already lost 1-week of time value premium so the stats you quote are lower than they would have been at the start of the March contracts.
By selling options against our stock or ETF positions, we are lowering our cost-basis and that is precisely the reason we should out-perform the overall, market (S&P 500) on a consistent basis.
I am modestly bullish on the current market environment and therefore choose to favor out-of-the-money strikes 2-to-1 compared to in-the-money strikes. Let’s say I sold 75 contracts at the start of the March contracts…50 would be OTM and 25 ITM. I am more likely to use OTM for stocks in bold in our reports (strongest technical indicators) and will “ladder” strikes when selling multiple contracts. For example, if I sell 3 contracts for stock BCI, I may sell 2 OTM and 1 ITM.
By mastering stock selection, option selection and position management, we should become elite option-sellers and out-perform the market on a consistent basis.
Alan
Good morning Alan,
I would like to amend my comment above since in hindsight it could sound either flip or derogatory about our options selling strategies. Neither was my intent!
A source of frustration I felt as a beginner and I hear from friends who I recommend some portfolio over writing, CSP selling and read your books to is they have an expectation of instant gratification which is not realistic.
I think of the premium I receive as cash flow, loss protection and cost basis reduction. If, for example, I get 2% in premium for the month on a security that goes down 3% it is hard to look at that as “income”. But it sure as heck was loss mitigation! And I “beat the market” for that stock that month!
What I have learned, for what it is worth, is that the risk is not in the option we sell: it is in the security we sell it against. And should that security go up there are ways to buy back and roll options so one does not miss out and can beat the market to the upside as well.
I suspect that is why you and Barry spend so much time identifying the best candidates. A great new week to all! – Jay
Jay,
I always appreciate and value your comments as beneficial assets to our BCI community.
Alan
Alan I read that low volatility stocks are best for covered calls. Based on this does the weekly report factor this in. Would I consider stocks that are listed in the weekly report to be all low volatility stocks or should I be doing more research. Does the grade like A, B, C in any way relate to volatility?
Is there’s percentage you would assign to low volatility like 30 percent and below. I realize this changes constantly but in considering a sell to open is this a valid factor to consider. I am finding in a monthly option if I wait for the first two weeks to pass that some of the options that I have such as NSP are turning positive since time decay is increasing. Would this be correct?
Harry
Harry,
You are spot on that we should factor in implied volatility of our covered call or put-selling positions. This can be accomplished without looking up specific IV stats although we do provide those stats in our ETF reports. By setting initial time value return goals, we are factoring in IV. For example, my goals for initial time value returns for near-the-money strikes is 2% – 4% (1% – 2% in my mother’s portfolio). This allows us to avoid high IV underlyings and still align with our personal risk-tolerance. More or less aggressive investors can adjust that range accordingly…one size does not fit all!
The stock report does show historical volatility with the “beta” column, the 7th column from the left. We use a 1-year time frame and the S&P 500 as the benchmark.
It is correct that time value erosion does increase as we approach expiration.
Alan
Alan,
I’m using your BCI-P&L_Spreadsheet_v last version and I have a question;
I bought MLNX at 105.84 and I sold the call at 105 strike, in order to fill the spreadsheet: do I have to consider the price ATM or ITM call since the difference is mall?
Thanks and sorry if my question is naïf
Have a nice day
Mauro
Mauro,
From a calculation perspective, the $105 strike is in-the-money (ITM) and the intrinsic value ($0.84) must be deducted from the total premium to calculate initial time value return (ROO).
That said, some investors will refer to a strike close-to, but not precisely the same, as stock price, as “near-the-money”
Alan
In using the PMCC calculator I have a couple of questions:
1) Trade Management Short Call Next Month Tab: Results are calculated for the Rolled Out/Up time value but what I don’t see is anything for the upside potential. Am I missing something?
2) Trade Management Rolling Long Call Leaps Tab: This is for rolling out only. Do you ever consider rolling out and up on the Leaps long call?
Thanks;
Terry
Terry,
1- Adding an “upside potential” cell to the Trade Management/ Roll out-and-up cell of the spreadsheet makes sense. I will work on this with my team.
2- The PMCC simulates buying a stock (or ETF) for the long haul and constantly writing short-term calls against this security. The initial trade is structured by factoring in the difference between the strikes. If we roll the LEAPS out-and-up, we are changing the initial structuring of the trade. We can certainly still do this but I would manage as follows: STC the LEAPS position. Since share price increased and assuming the initial structuring was done properly, we close the entire trade at a profit. At that point, the new parameters can be used in the initial structuring tab.
Alan
Premium members:
This week’s 8-page report of top-performing ETFs and analysis of ALL Select Sector Components has been uploaded to your premium site. The report also lists Top-performing ETFs with Weekly options as well as the implied volatility of all eligible candidates.
New members check out the video user guide located above the recent reports.
For your convenience, here is the link to login to the premium site:
https://www.thebluecollarinvestor.com/member/login.php
NOT A PREMIUM MEMBER? Check out this link:
https://www.thebluecollarinvestor.com/membership.shtml
Alan and the BCI team
2/27/19 9PM ET
Barry – The latest ETF report for 2/27 duplicates the first 3 stock picks for ETFs, 4, 5, and 6.
Mario
The text is correct for the 6 ETF picks. It is the first charts that is incorrect.
Thanks Mario. We inserted the correct image and the report now reads ETF report 2-27-19 REVA.
Alan
Alan
How are you? I have started to read your Excel
File where you mention the stock you team already analyzed.
So based on this list I should do sales cover call ? I am right ?
Best Regard
Daniel
Daniel,
The weekly stock and ETF files we provide to our premium members represent the best underlyings for option-selling based on the BCI methodology screening process of fundamental, technical and common-sense analysis.
We make selections from these files based on portfolio makeup (we won’t add another computer hardware stock if we have others already in our portfolio), personal risk-tolerance (some may not reflect the appropriate volatility to meet our initial time value return goals) and cash available (some may be too expensive).
Check out the videos on the membership site to see examples as to how members can use these files.
Alan
Mark,
Even though we are in the second week of a 4 week cycle you can still make some good choices.
Since you mention you are a beginner, I hope some of my comments will help you and some others. .
Selecting run list symbols to invest:
Remember you also have to diversified with different position (symbols) – I usually end up with around 5-6 identical position in my several accounts beween Fidelity and Etrade (IRAs and Indivitual and 1 trust (5 accounts).. I generally do not break up one symbol position with the contracts of that symbol some OTM and some ITM. The management then becomes too compiicated. There are enough items to keep track in a portfolio.. Remember, when Exp Friday comes, you have to find the time to manage those positions, as well as during the period. (Alan states he does Exp Friday work late in the afternoon. I have not found that possible for me when you have to evaluate Rollout, Rollout and up, play the spread, etc., so I generally allow 1/2 hour per position on Expiration Friday.
What I do is break up my OTM and ITM position between symbols positions.. That’s a better manageable implementation. My goal is to get 92% invested.
I look at the price chart of a stock in the run list and make decision on whether it should be ITM or ITM based on the recent past history.
If moving sideways or show some volatility, and I see a 1.8 – 2.5% return, I will select an ITM posture. Of course if the price of the position is near the upper strike, the ROO% is lousy and I may then pick the OTM upper strike.
If the stock price is rising steadily in the chart, I will select an OTM strike, again in the 1.8 – 2.5 range.
Once I have filled my order, I set the 20% / 10% threshold points with a Buy to Close order. (Remember to change or delete them when the time periods expire and there is no action.
Documenting:
I keep track of my portfolio as I trade by manually entering the kep points on Paper (I call it a Trade Log) and keeping track of the Return Cost Basis and Breakeven point and Cash Balance over one or more months a trade as your roll out to other months. That way I know my Gain/Loss and %Return (ROO%). I also keep a second summary record (Trade Column Log) so I quickly can see positions and make notes.
I am sure BCI members have different methods and techniques to document their trades. I have tried EXCEL (time consuming) and other systems.Remember I have 5 accounts with multiple positions. It would be simpler if I had just 2 accounts but that is not what it is now.
FINVIZ:
I have found a tremendous time save to enter the run list in a FINVIZ portfolio. All the run list. If the run list exceeds 50 stocks, then I code the portfolio with a A, B suffix. When entering the run list in FINVIZ, I code the number of shares to identify bold and Standard stocks in the run run list, and also code the run list stocks for those with earning dates that should not be picked until the ER date has passed. Cool system.
If you enter the FINVIZ portfolio before Market opening on Monday, a simple mouse click will enter last Friday’s close for you. That’s a time saver. I do the same thing with my ETFs from the ETF Report.
I like FINVIZ because you can mouse over a stock symbol and quickly see the recent price chart and you can also view News and other stock information.
Fidelity Portfolios / Watchlist:
I keep track of my 5 accounts very efficiently by using the portfolio / watchlist capability in Fidelity. You can even use them if you do not have an account if you just register at Fidelity.
The nice thing with a Fidelity Watchlist if you can enter both Stock position and Option positions, as well as Cash positions so you can see a complete picture of your account value, real time price changes and other nice information. I end up with 2 Watchlists.
One watchlist has my own IRas and Individual accounts (4 accounts). With 50 line items, I include my stock position, options, Cash positions. I use dummy Money Market accounts to keep track of the 4 cash accounts.
The second watchlist has a Joint Trust Account that we have.
To trade in Fidelity you can use the Online Menus or use the Fidelity Active Trader Pro (ATP) program for more control and easier trading and control. The watcholist you create either on line or in ATP program is viewable and manageable online or in ATP.
Good luck with your trading.
Mario
Alan,
I was unable to read last weeks blog (Week ending Friday 2/22/19) until last Sunday. After reviewing, I was quite impressed at the variety and excellent question posed by BCI members and the answer given. One of the best blog threads I have read in the several years I have been trading your system.
I may go back and respond to some of the questions later in our current blog..
You can be proud of the response you are getting with the BCI system and the assistance you give and tools you have developed to break into simpler terms the Option mystique.
Mario
Mario and all members,
I always say that BCI’s success is directly related to the quality and participation of our members.
Thanks to one and all.
Alan