Stock and ETF (exchange-traded fund) selection is one of the three required skills needed to achieve the highest level of success when selling options. Covered call writers and put-sellers have varying degrees of personal risk tolerance and trading styles. As a result, over the years and based on member feedback, the BCI team has added additional screening service reports for our members along with our core stock reports. Since we are beginning a new contract month and because we have had such a large growth in premium membership recently, I thought it would be beneficial to write an article showing how we can fund our covered call writing and put-selling portfolios using three of our reports. The securities shown do come from our most recent reports but do not include the 11/18/2016 stock report which was not produced at the time I am writing this article. These are not necessarily specific recommendations but rather intended to show one of the many ways these screened reports can be utilized. In this article, we will fund a portfolio with $100,000.00 cash available.
Reports used to fund our portfolio
ETF Report:
Screens for the top-performing exchange-traded funds over the past 3 months that have adequate option liquidity. We will focus in on page 4 of the report that charts the top 3 Select Sector SPDRs which will utilize the top one third of the S&P 500 from a performance perspective. Here is a screenshot taken from the 11/16/2016 report:
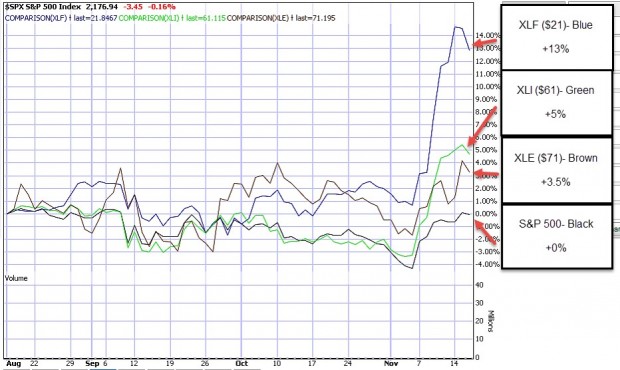
Top Select Sector SPDRs as of 11/16/2016
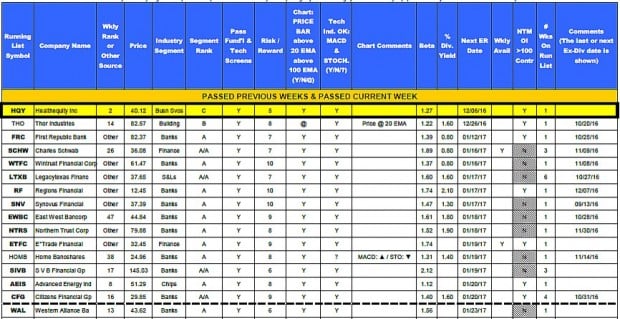
Blue Chip report:
Quarterly screen for top-performing Dow 30 stocks. Eligible candidates have out-performed the S&P 500 over the past three months as well as the past one year. Here is a screenshot taken from the 4th quarter, 2016 report:

Blue Chip Report: 4th Quarter, 2016
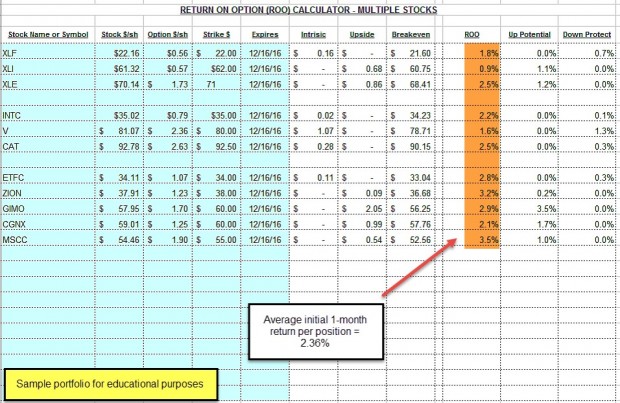
Premium Stock Report
This report is the foundation of the BCI methodology. It involves fundamental analysis, technical analysis and common sense screening. Here is a partial screenshot taken from the 11/11/2016 report:
Premium Stock Report as of 11/11/2016
Hypothetical allocation of cash assets
ETF Report: 3 Select Sector SPDRs/ $25,000.00/ about $8,000.00 per position
Blue Chip Report: 3 stocks/ $25,000.00/ about $8,000.00 per position
Stock Report: 5 stocks/ $50,000.00/ about $10,000.00 per position
***Some cash must remain unused for potential exit strategy opportunities and to pay trading commissions
Hypothetical selection of securities
ETF Report (top-performing Select sector SPDRs)
- XLF- 400 shares
- XLI- 100 shares
- XLE- 100 shares
Blue Chip Report (watching prices as we are allocating about $8,000.00 per position; avoid expensive stocks)
- INTC- 200 shares
- CAT- 100 shares
- V- 100 shares
Stock report (favoring bold, high industry ranks of “A” or “B” and diversification)
- ETFC (financial)- 200 shares
- ZION (bank)- 200 shares
- GIMO (internet)- 200 shares
- CGNX (Electrical)- 200 shares
- MSCC (chips)- 200 shares
Cost of funding portfolio and cash balance (as of Friday morning 11/18/2016)
Shares will cost $95,087.00 leaving $4913.00 for commissions (must use online discount brokers with LOW commissions) and exit strategy opportunities.
Initial 1-month calculations (as of Friday morning 11/18/2016)
Sample Portfolio: Initial Calculations
Of note:
The overall portfolio initial 1-month return average is 2.36% The stock report (bottom five securities) offered the highest initial returns followed by the blue chip report (middle three) and then the ETF report (top three) …no surprise there. Here’s the breakdown of the averages from each report:
- ETF: 1.4%
- Blue Chip: 2.15%
- Stock: 3.1%
Keep in mind that I did not have available this weekend’s stock report which I will be using to fund my personal portfolios next week. Also, the stats were taken on Friday morning but should be reflective of typical returns.
Discussion
There are many ways to screen for option-selling candidates. This article presented three screens that can be utilized based on personal risk tolerance and strategy goals. I favor the BCI Premium Stock Reports in my portfolios and the ETF Reports in my mother’s one portfolio. There is no right or wrong here as long as our decisions are non-emotional and based on sound fundamental, technical and common sense principles. Finally, (and I know you saw this coming), once our positions are entered, we must be prepared for potential exit strategy opportunities.
Upcoming live events
December 1, 2016
Blue Hour webinar 3: Registration now open and free to premium members. Limited seating…register now.
Thursday at 9 PM ET
Premium members login and scroll down on the left side as shown in the screenshot below (top screenshot). General members can purchase a seat at the Blue Collar store (https://www.thebluecollarinvestor.com/store/) as shown in the lower screenshot:

Blue Hour Webinar: Member Signup
Blue Hour Webinar General Registration
Event information and registration can be accessed at these links.
***Thanks for submitting so many great questions. I will respond to 3 or 4 as part of the webinar presentation.
December 6, 2016
Options Industry Council Webinar Summit
Tuesday afternoon…1:30 PM ET:
FREE…compliments of the OIC
Those who register but cannot make the live event will be sent a link to the presentation recording.
February 27, 2017
Stock Trader’s Expo
Marriott Marquis Hotel, NYC
1:30 PM ET
Exhibit hall Booth 208 (February 26th – 28th) … come say hi to the BCI team
Market tone
Global stocks moved up this week on continued hopes that looser US fiscal policy will quicken the pace of global economic growth. Volatility, as measured by the Chicago Board Options Exchange Volatility Index (VIX) fell to 12.85 from 15.5 a week ago. Oil prices rose slightly ahead of a meeting between Saudi and Russian oil ministers, who are trying to broker a production cut. This week’s reports and international news of importance:
- US Federal Reserve Board chair Janet Yellen told the Joint Economic Committee of the US Congress that the economy is making very good progress and that a hike in interest rates could come relatively soon
- Markets have fully priced in a 25 basis point hike in the federal funds rate target at the next Federal Open Market Committee (FOMC) meeting in December
- The results of the US presidential election have not altered the Fed’s assessment, she said
- With the resignation of Chair Mary Jo White, the five-member US Securities and Exchange Commission will be down to just two members in the final weeks of the Obama administration. One Democrat and one Republican will remain, giving the Trump administration the opportunity to reshape the commission
- President-elect Donald Trump has begun to fill out his cabinet and senior staff appointments. The first cabinet post announced was Alabama senator Jeff Sessions (R. Ala.), who will serve as attorney general, if confirmed by the Senate. Reince Priebus, the chairman of the Republican National Committee, has been appointed White House chief of staff, while Lt. Gen. Michael Flynn will serve as national security advisor. Kansas congressman Mike Pompeo will head the Central Intelligence Agency
- The United States reported a 0.8% rise in retail sales, while September sales were revised upward to 1%. The strong data adds to the Fed’s already compelling case for a December rate increase
- In the United Kingdom, October sales rose at their fastest pace in 14 years, jumping 1.9%
- Housing starts surged to a nine-year high in October, jumping 25.5%
- The Bank of Japan was able to halt a slide in Japanese government bonds this week without actually having to make any purchases
- Reuters reported this week that multinational corporations are selling their Venezuelan operations at steep discounts. Supply shortages and runaway inflation are cited as the principal reasons
- The German central bank this week issued a financial stability report in which it found that, while the country’s banks are robust, they suffer from weak profitability and may be underestimating the risks of falling asset prices and rising interest rates
- The Mexican peso’s plunge in the wake of the election of Donald Trump has forced the Bank of Mexico to raise interest rates to their highest level in over seven years
THE WEEK AHEAD
- US existing home sales data are released on Tuesday, November 22nd
- Global flash purchasing managers’ indices are released on Wednesday, November 23rd
- The minutes of the November meeting of the FOMC are released on Wednesday, November 23rd
- US markets are closed for Thanksgiving on Thursday, November 24th
- Germany reports third quarter gross domestic product data on Thursday, November 24th
For the week, the S&P 500 rose by 0.81% for a year-to-date return of +6.75%.
Summary
IBD: Market in confirmed uptrend
GMI: 5/6- Buy signal since market close of November 10, 2016
BCI: The market has successfully absorbed the election results and so it’s back to business as usual for The Ellman portfolios. I plan to fully fund my portfolios and that of my mother with securities selected from the 3 reports alluded to in this article. I will take a cautious approach by selling an equal number of in-the-money and out-of-the-money strikes.
WHAT THE BROAD MARKET INDICATORS (S&P 500 AND VIX) ARE TELLING US
The 6-month charts point to a bullish outlook. In the past six months the S&P 500 was up 6% while the VIX declined by 20%.
_____________________________________________________
Wishing you the best in investing,
Alan (alan@thebluecollarinvestor.com)
I am somewhat confused by exit strategies. I currently have 300 shares of IPHI with a break even or $35.889. I sold a call 10/24 with a strike price of $40 and a 1/20/17 date. Setting the strike date out three months was unintentional, careless error. Nonetheless it is what it is.
It seems to me it would be a good time to exercise an exit and profit from the current price of $46.39 a share.
The option chain for 1/2017 shows bid-ask spreads:
Calls: $7.30 – $8.50
Puts: $0.95 – $1.20
If I want to exit I know I have to execute a “buy to close” transaction. Is this a Call at the ask price or a put at the ask price?
Also, assume for discussion purposes that the chain for 1/20/17 no longer appears in the chain. What if any option could be exercised?
Thank you for your response and patience.
Tom
Tom,
My responses:
1- To close an options position we must buy back the very same option we initially sold…same stock, same strike, same expiration. Since you sold the Jan. $40.00 call, you must BTC the same Jan. $40.00 call.
2- The only time an option will disappear from the chain is a result of a corporate action like a stock split, merger, acquisition, special 1-time dividend etc. These are rare but do come up from time to time. There are sites to get explanations (CBOE.com) but may be best to ask your broker.
3- To figure if it’s a good time to close we must calculate the cost-to-close and then see if we can use the cash to make up for the loss and more. The bid-ask spread is $7.30 – $8.50. We can probably get a better ask price by leveraging the “Show or Fill Rule” but let’s take worst case scenario and use $8.50. Before closing, our shares are worth $40.00 due to our option obligation. When we buy back the option, shares are now worth market value or $46.39, a credit on the stock side of $6.39. Our net debit to close is ($8.50 – $6.39) $2.11 + commissions. Without knowing precisely what you paid for the shares, I’ll estimate that at this point in time you are up between 10 -11% for the month. By closing you will lose about half of that…still no Kleenex for Tom!
If IPHI closes above $40.00 on expiration you will have generated 10-11% for the3-month time frame. The question is: if you close now can you generate more than 5-6% over the next 2 months?
Let me know how the trade works out.
Alan
Premium Members,
This week’s Weekly Stock Screen And Watch List has been uploaded to The Blue Collar Investor Premium Member site and is available for download in the “Reports” section. Look for the report dated 11/18/16.
Also, be sure to check out the latest BCI Training Videos and “Ask Alan” segments. You can view them at The Blue Collar YouTube Channel. For your convenience, the link to the BCI YouTube Channel is:
http://www.youtube.com/user/BlueCollarInvestor
Since we are in Earnings Season, be sure to read Alan’s article,
“Constructing Your Covered Call Portfolio During Earnings Season”. You can access it at:
https://www.thebluecollarinvestor.com/constructing-your-covered-call-portfolio-during-earnings-season/
Best,
Barry and The BCI Team
Premium Members,
The BCI Premium Report for 11/18/16 has been revised and uploaded. There was a typo in the “GMI” indicator on the first page of the report. It should read “5/6- Buy signal since market close of November 10, 2016”.
Best,
Barry and The Blue Collar Investor Team
Alan,
Your book stresses diversification, which as a novice investor with limited capital, I may not be able to achieve full diversification as good as the example in the book.
As I review the Weekly Stock Screen and Watchlist, I am intrigued by this section and perhaps gaining diversification thru an ETF fund as you also explained in the book.
WEEKLY ETF SUMMARY (3 month returns): The following are the top performing ETFs over the past 3 months as of 11/16/16 per the BCI ETF screening guidelines: ● KRE (SPDR S&P Regional Bank ETF): +23.0% (Wkly) ● KBE (SPDR S&P Bank ETF): +22.0% ● DJX (Wisdom Tree Japan Hedge Eqty): +14.0% (Wkly) ● XLF (SPDR Financial Select Sector): +13.0% (Wkly) ● SOXX (iShares Phlx Semicond): +9.5% ● XME (SPDR S&P Metals & Mining): +7.5% (Wkly)
The following are the top 3 performing Select SPDR Sector ETFs as of 11/16/16per the BCI ETF screening guidelines: ● XLF (SPDR Financial Select Sector): +13.0% (Wkly) ● XLI (SPDR Industrial Select Sector): +5.0% (W kly)
The 2 sections seem redundant, but I’m not sure. The bottom section appears to be all SPDR’s but the top section I’m not sure. [1] What is the difference between these 2 sections?
I’m also not sure how to read the returns listed here. [2]Are these the returns of the funds, the options, or a combined return for both? [3] Are these the weekly returns for both sections or 3 month returns for the top and bottom sections. I did read (Wkly) means that weekly options are available. Pretty sure I’m not interested in weekly. I would not have the time to manage properly.
Thanks,
George
George,
Achieving diversification via ETFs is a sensible approach and one of the main reasons for using ETFs. here is an overview of our Premium EF Reports:
Pages 1 and 2 graphically displays the top 5-6 best performing ETFs based on the criteria described on the top of page 1.
Page 4 graphically displays the top-3 performing Select Sector SPDRs for those who want to participate in S&P 500 companies only. There may or may not be overlap with pages 1 and 2.
The bottom of page 4 shows all eligible ETFs that have Weekly options associated with them. I do not use Weeklys but many of our members do so we include this information in our ETF and stock reports.
The top of page 5 lists all Select Sector SPDRs and their performances over various time frames. We highlight the 3-month time frame which we feel is appropriate for our short-term analysis. This geared to members who hold ETFs that didn’t make our top-3 list this week and want to view their performance.
Page 6 shows inverse ETFs, securities appropriate only in extreme bear markets (2008, for example).
Pages 7 and 8 shows the implied volatility of all eligible candidates so members can access risk.
Alan
Alan,
While all your blog articles are informative and helpful this is one of your best! A practical guide to constructing a covered call portfolio.
If one assumes the Trump rally has legs, the rate hike is baked into the pie and seasonal strength will hold this year unlike last a concern with covered calls may arise from fear of missing full gains. It’s irrational but human. I fight it all the time :)!
A tactic that has worked for me when my charts and my gut tell me the market is heading higher is only cover half of my positions. I pick a few stocks off our list. I buy them on a down day. On the next nice up day when my position has appreciated and call options prices are higher I sell an ATM call on half the shares.
That way if I am right half will run without the cost of buy back and half will get called at a profit unless I buy back and roll looking for more. If I am wrong I have some loss protection and a position I still believe in. It’s a derivative of your tactic splitting ITM/OTM strikes.
The beauty of a strategy as simple on it’s face as selling calls and puts is it’s great flexibility for personal style and market conditions. – Jay
Jay,
Have you thought about buying long calls instead of stock on the half of your position that is not covered? You can get a similar outcome, athough with a bit lower return. Think about buying the calls with a delta of .70, two months out (be careful of ER dates however). That way you are getting about 70% of the stock’s movement at about 25% to 35% of the cost. As the stock rises you will profit from the long calls. This will take more management but it is an alternative that you might want to think about.
Best,
Barry
Barry,
Thank you for the intriguing suggestion!
Let’s say I own 200 shares of BCI and think it will go up. In my model I would sell one contract and let the other half run. Is the thought to sell a call on half and use the proceeds to buy a further dated call out in front to leverage any gains?
Or is the thought to buy calls as a stock replacement strategy and not own the under lying? I understand the thinking with the .70 delta.
Thanks for getting my wheels turning :)! – Jay
Jay,
Barry is right, a DITM call option for 2-3 months requires very little premium.
NVDIA’s astronomical rise this year really has been a cautionary tale against betting too conservatively when Mr. market is telling you to go.
I put about 15% of my portfolio in DITM calls on stocks mostly in the premium list for the next few months (the rest of the portfolio is in covered calls of course). My plan is to manage the calls using the win/loss rules outlined by William O’neil and make close to even if the rally doesn’t have legs.
Options volatility increases with and increase in delta. If there was a drop in the stocks that I bought calls for, then the volatility should buy a little bit of time for an exit without getting creamed.
The big risk is a huge market crash for all of the long options. I bought a few extremely out of the money spy puts as a small hedge against a catastrophe. We’ll see if the strategy works, but I’m optimistic.
Thanks Caleb,
For more aggressive portfolio allocations like your 15% buying DITM calls at a time when further market gains seem a good bet makes all the sense in the world. Particularly with VIX below 13 and the cost of options being relatively cheap – as we lament on the sell side :).
I am going to take a deeper look at it. In general my experience buying options has not been as good as selling them. Even if you go out 2-3 months you still have be correct reasonably soon or losses coupled with time decay will mount fast.
Please keep us posted on how your plan works and best wishes for profit with it! – Jay
Jay,
My thoughts were more towards a stock replacement strategy approach using the long calls.
Best,
Barry
Thanks Barry, Happy Thanksgiving! – jay
Premium Members,
The BCI Premium Report for 11/18/16 has been revised and uploaded. The ER date for THO was updated. THO’s first quarter is a two month quarter this year. Look for the report dated 11/18/16-RevB.
Best,
Barry and The Blue Collar Investor Team
Alan, I first thank you for that answer to my last weeks question I asked about the RSI, because what you stated was most likely the way I would have analysed it too!
I have some questions below with the last one being important:-
1. If a stock you are holding is falling in price & underperforming then you said it’s best to sell the stock,- but would you still sell if the price was approaching a support level, and/or an Up-trendline?,- And if you would, then does this mean you would sell immediately from after seeing that the price-performance line of the market is greater than the stocks price?
2. If I were to compare the trading of someone who plays the B/A spread on every single option trade every month, to someone else who only just uses the ‘Bid’ or ‘Ask’ price, then are you able to estimate for me approximately how much more percent per year(on average) I would likely generate by playing the B/A spread?(I thought maybe another 3%+ ?)
3. In determining an options price there is an options website I know of that has a strategy calculator chart.
On it I can enter the details of my options trade(eg. expiry date, strike, dates, price, etc) to come with a theoretical price for that option on that dates price.
Would you say that this is a great way to find the estimated option value if I am not quite sure my option values looked correct? (and also adding/subtracting half the spread value on/off it?)
4. I am wondering how accurate I need to be drawing trendlines, as the charts on ‘finviz.com’ show the trendlines to nearly always be plotted in differently to how I draw them?
5. And most importantly, I had emailed you a over a week ago my reply to your last answer on the Calculations but I still haven’t got a reply back?(I sent it on the 10th Nov),- have you got it?
You should find it a lot clearer to understand as I have took a lot of time to format these past trades in more detail.
(Just really needing a confirmation that the % return is right.)
Well I’ll resend it twice so hope you get it.
That’s all I need to ask for the moment. Thanks
Adrian,
1. I would add one more important caveat to your hypothetical…the short call position has met the 20%/10% guidelines. After that occurs, a declining stock that is under-performing the overall market is a candidate to sell. Another factor to consider is whether the decline is early or late in the contract. If early, I may wait a few days to see if I can “hit a double” Later in the contract, rolling down is a possibility especially if you see the stock trading above support.
2. I never calculated an annualized return when leveraging the “Show or Fill Rule” but it certainly is an interesting question. I can say that each month I see an additional several hundred to a thousand dollars in my account by playing the B-A spread (I do have a substantial number of positions).
3. Some option traders measure the theoretical value of an option with the intent to buy an under-valued option and vice-versa. As option-sellers, it is of utmost important to screen for the most appropriate underlying stocks and then address the moneyness of the options we sell. If the returns then meet our goals, the trade should be considered despite the relationship between the theoretical and actual value of the option. Markets have a way to make sure the value of our options remain in line with proper pricing.
I’ll get back to you on 4 and 5.
Alan
Adrian,
Trend lines are meaningful but only a piece of the puzzle. technical analysis, as much as we would like it to be a precise science, is as much an art as it is a science. I like to see a security price at or above the support of the 20-day EMA. If it dips slightly below for a day or two on light volume, I may still consider the stock.
I will check my email box for #5…
Alan
Alan,
If there is an large amount of open interest in in-the-money options and little or no interest in near-the-money or out-of-the-money options, is it safe to assume that sentiment is bearish?
Rudy
Rudy,
Not necessarily. Open interest is a cumulative statistic and shows contract activity over a longer time frame than does Volume (activity for the current day only). If a stock price has been rising significantly, many near-the-money contracts are now in-the-money and sentiment will probably be bullish.
If you have an example, send it over.
Alan
Premium members:
This week’s 8-page report of top-performing ETFs and analysis of ALL Select Sector Components has been uploaded to your premium site. The report also lists Top-performing ETFs with Weekly options.
For your convenience, here is the link to login to the premium site:
https://www.thebluecollarinvestor.com/member/login.php
NOT A PREMIUM MEMBER? Check out this link:
https://www.thebluecollarinvestor.com/membership.shtml
Alan and the BCI team
Alan,
First of all a VERY happy Thanksgiving to you and your family!
Now for my question. I am going over the Premium Report for next months positions. I tend to try to buy companies with lower stock prices and yet with a ‘Segment Rank’ as high as possible. In all of your studies, have you determined that companies with stock prices say less than $30 are in a higher risk category? Saying this another way, are these stocks a higher risk then say a company that is at $100 per share? I realize for the most part it is all about the market and these companies success within these markets. Are they more volatile?
Jim
Jim,
You ask an excellent question. Taking it to the extreme, penny stocks (you will NEVER find these in our reports!) are the ultimate example of low-cost-high-risk securities…stay away. But what about those that have passed our rigorous fundamental, technical and common sense screens? In these cases I would not use price to measure risk but rather option returns. We are taking on very short-term obligations and the market will tell us how much risk we are incurring by the price of the options. The greater the option returns, the higher the risk. Here’s how I do it for my covered call or put-selling positions. I set a goal for initial 1-month returns between 2-4% for near-the-money strikes. In bull markets I will go as high as 6 % but never higher. In my mother’s more conservative account, I will use underlyings that generate 1-2% for initial 1-month returns. That will allow us to craft positions that meet our personal risk tolerance. For those more aggressive than I am, goals can be set higher and vice-versa.
Happy Thanksgiving to one and all!
Alan