Trading volume is the number of trades for a security in a given time frame. On a chart volume is typically represented as a histogram (vertical bars) and represents a confirmation or lack thereof of the other technical indicators. For example, if a moving average breaks below support on high volume, it is more significant than if the event took place on low volume. Volume can also serve as a red flag if a stock is trending higher on decreasing volume. We also want to confirm that there is adequate trading volume for our stocks and options to ensure the best opportunities for favorable price executions. In the screenshot, note how the accelerating volume is confirming a series of bearish signals:
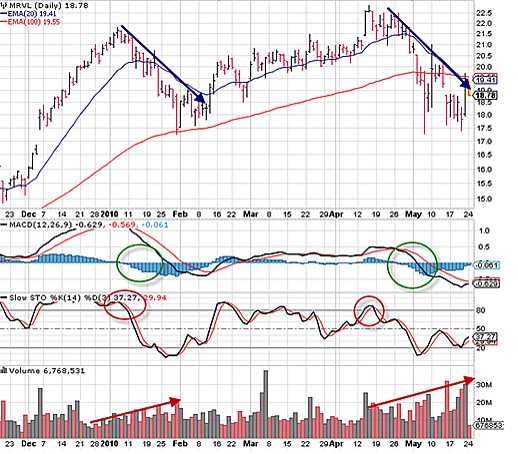
Volume Bars Confirming Bearish Signals
Most traders are familiar with trading volume but many have never been introduced to the term deliverable volume.
What is deliverable volume?
This is the actual percentage of total trading volume that results in transfer of shares from one account to another’s. Stated differently, ownership is actually transferred. For stocks, deliverable rate is quite high because a buyer wants to buy and a seller wants to sell and so a transaction occurs with ultimate delivery of the underlying.
When is trading volume high but deliverable volume low?
This occurs when shares are bought and sold multiple times for the same date. The credits and debits are netted against each other and only the difference is settled.
These scenarios fall into 3 categories:
- Lots of day-trading with little intent to actually own the underlying
- Initial Public Offerings (IPOs)
- Newly-listed stocks
IPOs and newly-listed stocks do not have the history necessary to gain entrance onto our watch lists while stocks that are day-traded are usually highly volatile and speculative and therefore inappropriate for conservative option-selling strategies.
How to interpret deliverable volume
- Bullish: Increase in deliverable % with high volume and price increase
- Bearish: Decrease in deliverable % with a price decline
Discussion
The percentage of deliverable stocks reflect the interest of long-term investors in taking positions with the underlying. The stocks we deal with in our covered call writing and put-selling portfolios generally do not fall into the 3 categories where the percentage of deliverables is significantly lower than normal. Confirming adequate stock and option trading liquidity is where we must be most focused.
Upcoming speaking event
Orlando Money Show: February 8th – 11th, 2018
Thursday, Feb 8, 2018
09:00 AM – 09:45 AM
All Stars of Options
“How to Select the Best Options for Covered Call Writing in Bull and Bear Markets”
Friday, Feb 9, 2018
12:15 PM – 03:15 PM
Premium Master Classes
“Basics of Options Trading Using Covered-Call Writing with Pro-Active workshop””
Friday, Feb 9, 2018
06:30 PM – 07:00 PM
Covered Call Writing with Dow 30 and S&P 500 Stocks””
All DVD Programs now available in streaming format with downloadable workbooks (click for information)
Exit Strategies for Covered Call Writing
All 3 programs bundled at a discount

Streaming DVD Programs
Market tone
This week’s economic news of importance:
- Case-Shiller home prices up 6.2 for October
- Consumer confidence index came in at 122.1
- Pending home sales for November 0.2%
- Weekly jobless claims for week ending 12/23 came in at 239,000, below expectations
- The stock market moved up 19.42% for the calendar year 2017
THE WEEK AHEAD
Mon Jan 1st
- None New Years Day
Tue Jan 2nd
- Markit Manufacturing PMI for Dec
Wed Jan 3rd
- Consumer spending
- ADP employment
- ISM manufacturing
- Construction spending
Thu Jan 4th
- Weekly jobless claims
- Markit services PMI for Dec
Fri Jan 5th
- Nonfarm payrolls
- Unemployment rate
- Foreign trade deficit
- Ism manufacturing
- Factory orders
For the week, the S&P 500 declined by 0.36% for a year-to-date return of 19.42%
Summary
IBD: Market in confirmed uptrend
GMI: 6/6- Buy signal since market close of August 31, 2017
BCI: My portfolio makeup moves to a bullish, selling 2 out-of-the-money strikes for every 1 in-the-money strike.
WHAT THE BROAD MARKET INDICATORS (S&P 500 AND VIX) ARE TELLING US
The 6-month charts point to a neutral outlook. In the past six months, the S&P 500 was up 10% while the VIX (11.04) moved down by 1%.
Wishing you a prosperous 2018,
Alan and the BCI team
Alan,
I am trying to understand the calculation of the cost basis for a ITM covered call position. Am I wrong reducing the stock price with the entire premium received? I read in your book that only the intrinsic value of the premium is used to calculate the cost basis. Why?
What happens to the real profit, the extrinsic value? Can’t I use that as well?
Example: stock price $34.23
ITM 33 strike option premium: $1.71
What is the right number? 34.23 – 1.71 or 34.23 – 1.23.
Thank you so much for your help,
Marta
Marta,
For tax purposes, we use the entire premium to reduce cost basis if shares are sold. The Ellman Calculator is not for tax purposes but rather for assisting us in making the best investment decisions at any given point in time. We can use the Schedule D located in the Elite version of the Ellman Calculator for tax calculations.
When we enter a trade, we do not know the final outcome. The stock may or may not be sold. When selling an ITM strike, only the extrinsic (time) value is calculated as initial profit because we could lose the intrinsic value component if shares are sold.
Let’s get to your example:
The $1.71 premium breaks down into $1.23 of intrinsic value leaving $0.48 in time value (initial profit). Since we are not using the intrinsic value as profit, we use it to reduce cost basis which becomes the strike price ($34.23 – $1.23). The calculations when entering a trade becomes ($0.48 / $33) = 1.5% The downside protection (of this time value profit becomes ($1.23 / $34.23) = 3.6%…we are guaranteed a 1.5%, 1-month profit as long as share value does not decline by more than 3.6% by contract expiration. An easy way to remember this is that, when selling an ITM strike, the cost basis is the strike price.
Glad to help.
Alan
Alan and other Yankees fans will appreciate this “Yogi-ism”: yesterday’s close felt like “Deja Vu all over again” as I watched the afternoon sell off.
No one knows – and that includes me – but it felt like 2015 going into 2016 where Santa missed a few stops, we did not get the rally then sold off 10% in January.
Yet that is hard to see this time around because Trump is a big spender, he has infrastructure spending on the table, has cut corporate taxes so mergers and acquisitions along with stock buy backs are more in play all of which should help the market.
2017 was the first year on record, per my reading, we did not have a greater than 3% pullback.The largest was 2.7% on the S&P. It was a dream year for dip buyers and OTM call writers!
2018 is a midterm year and always weakest on average for the market in the 4 year Presidential Cycle since record keeping began. If 2018 is average the year will be flat.
No better time to be an option seller/portfolio over writer! – Jay
Premium Members,
This week’s Weekly Stock Screen And Watch List has been uploaded to The Blue Collar Investor Premium Member site and is available for download in the “Reports” section. Look for the report dated 12/29/17.
For your convenience, here is the link to login to the premium site:
https://www.thebluecollarinvestor.com/member/login.php
Also, be sure to check out the latest BCI Training Videos and “Ask Alan” segments. You can view them at The Blue Collar YouTube Channel. For your convenience, the link to the BCI YouTube Channel is:
http://www.youtube.com/user/BlueCollarInvestor
On behalf of Alan, myself, and the entire Blue Collar Investor Team…we wish you a Happy, Healthy, and Prosperous 2018.
Best,
Barry and The BCI Team
barry@thebluecollarinvestor.com
Alan and BCI Team,
Until recently, I was a buy-hold mutual fund investor. I’ve read the Encyclopedia for Covered Call Writing and have been perusing the information on the BCI website. Admittedly a baby step, but I sold my first couple options last week (portfolio overwriting). I plan to “make haste slowly” as I continue climbing the learning curve.
It may be addressed somewhere in the website, but I had a couple questions:
1) If you’re off-cycle from the monthly options expiry (3rd Friday), is selling a weekly option that’s 30 days out roughly the same thing as selling a monthly option on cycle?
2) In the Weekly Stock Screen Report, you typically mention your ratio of ITM/OTM calls based on your market outlook. Do you ever sell ITM and OTM against the same underlying (Although this represents a loss of diversification, I figured it also eliminates a variable)?
I hope all is well and that you have an enjoyable and prosperous New Year!
Best Regards,
Andy
Andy,
My responses:
1. Yes, the Weeklys 1-month out are similar to Monthlys with the caveat that the option liquidity (open interest) is usually lower for Weeklys and may result in wider bid-ask spreads and less favorable price executions. I try to keep all my current positions with the same expirations for management purposes.
2. Yes, I actually have a term for this…”laddering strikes” See pages 111 – 113 of “The Complete Encyclopedia…” and a link to an article I published a few years ago:
https://www.thebluecollarinvestor.com/selecting-the-best-strike-price-2/
Alan
Not a lot of bold picks that passed all screens in the weekly list!
Hi Terry,
Hope you had a great holiday! If this week stays this strong Barry will have to add extra type set for pages next week :)?
It is great to see the market start the year on solid footing. There are no shortage of studies extrapolating the first few trading days out into full year implications. So far so good.
I like the way the year sets up for the market: Trump has the checkbook open and has shredded the deposit slips :).
I would never try spending increases and income cuts in my budget! But it works for the Party in power and the market most of the times it has been done :). – Jay
Happy new year Jay,
the way I see it, the US is the locomotive.
It was slowed down and almost stopped by the subprime debacle.
The doctors gave the right medicine, and now the train is moving again.
By priorizing spending in infrastructure and cutting taxes, I believethe the locomotive will get back to full speed.
Good luck to Trump,
Roni
Happy New Year to you as well, Roni!
But that is it with the “Happy New Year” stuff ! The folks that used to keep saying it all through January around the office annoyed me when I was working :).
I may be better traveled than some/most Americans? I have actually been to 4 other countries. I was always sensitive to not confirm the stereotype of “The Ugly American” who expects others to adapt to him not vice versa. Trump should try that.
The US market is a leader but it’s not the only bull or bear in the forest! Most good traders watch the global markets as we move through the time zones to see at least what Asia and Europe are doing.
My international holdings at the moment include Japan, China, India, Brazil and Germany. I should probably have more.
I like the locomotive analogy and hope the train stays on the tracks in 2018! – Jay
“I like the way the year sets up for the market: Trump has the checkbook open and has shredded the deposit slips :).
I would never try spending increases and income cuts in my budget! But it works for the Party in power and the market most of the times it has been done.”
Jay, you need an accountant who when asked “How much is 2+2?”, he replies with “How much would you like it to be?”
HNY
Thanks Spin,
I am sure Washington D.C. is crawling with accounts like that. I still like 2+2 to equal 4 :). – Jay
2+2 sometimes = 22
Those of you living in the US had best ensure that 2+2=4 on your tax returns, given how enthusiastically you lock up your citizens over there 🙂
Justin
Have some pity for the prison stocks. How are you going to prop their share prices up if you’re not a world leader at incarceration (over 20% of the world’s prisoners)?
That’s true Spin – also world leaders in obesity and shooting one another dead 😛 At least you can get decent medical… no wait, “worst healthcare system in the Western world”. Ok I’m safer here in Australia, can’t get eaten by bears over here either 🙂
Justin,
Sadly, many American prisons and county jails now only offer video phones in order to visit inmates. Rates can be anywhere from $3 per minute to as high as $1 per minute. Since the majority of inmate’s families are low income, it really hits them hard. The big player in this area is Securus Technologies but it’s a private company. Yep, we lead in all sorts of categories, good and bad.
As for the bear thing, don’t worry about it as long as you’re not alone when you have that encounter. All you have to do is be able to outrun your partner :->O
Spin
Premium members:
This week’s 8-page report of top-performing ETFs and analysis of ALL Select Sector Components has been uploaded to your premium site. The report also lists Top-performing ETFs with Weekly options as well as the implied volatility of all eligible candidates.
New members check out the video user guide located above the recent reports.
For your convenience, here is the link to login to the premium site:
https://www.thebluecollarinvestor.com/member/login.php
NOT A PREMIUM MEMBER? Check out this link:
https://www.thebluecollarinvestor.com/membership.shtml
Wishing you a healthy and successful 2018,
Alan and the BCI team
Alan,
Who provides stats on deliverable volume versus traded volume? Not kidding but I Googled it and all I could find were stats from the Bombay Stock market. What’s the source for this data for U.S. stock exchanges? Thx
Spin
Spin,
The Bombay Stock Exchange was my main resource for this article. I am unaware of which other resources provide this information. It was written in response to 2 emails I received about 6 months ago. One traded on the BSE and the other here in the US. Both inquired about the significance of “deliverable volume” BCI has members in 80 countries outside the US. Most trade on US exchanges, some do not. I try to be responsive to all members.
Alan
Alan,
What is the average return bci members look for when setting up their trades. I know you say 2-4% in your accounts. Is this typical?
Thanks,
Marsha
Marsha,
The range is extremely wide, given the feedback that I have received over the years, probably falling into a 1-6% range for 90% of our members. I do use 2-4% (up to 6% in strong bull markets) as a guideline for my portfolios but a more conservative 1-2% in my mother’s account.
Alan
Marsha,
I am very conservative because most of my stocks were bought years ago and have gone way up in price so I don’t want to sell. I use far out of the money options and look to get another 1/2% each month with options.
Good luck.
Ellen
Hi Ellen,
I too have become a portfolio over writer and am perfectly happy with .5 to 1% in the months I even over write at all. I did not do any this month since I thought January might be strong. I do most of my over writing in the seasonally average to weak months per sources like Stock Trader Almanac.
But that is tough to pick in any given year. In 2017 there were no months when the S&P went down. Still, over writing far OTM to protect cost basis in cash accounts and even in IRA accounts makes sense to me. I prefer not to turn my investing portfolio over much, not pay a lot of commissions and still add from 4 to maybe 10% a year in yield depending on how often and at what target % I over write.
We can talk about all the nutty stuff I do in my trading account another time :)! – Jay
Jay,
Thank you for your comments. I look forward to more posts and ideas.
Ellen
Hey Ellen,
Thanks for the reply and welcome to our merry little group!
In my opinion your .5% over writing strategy on positions you don’t want to sell is outstanding. Particularly if they are in a cash account. I think Alan and Barry will be talking about that in their upcoming book.
I am retired and do all of my investing and trading in IRA’s so I am not as concerned about cost basis since it is all income when it comes out.
I am surprised – OK, shocked – at how well the market has started 2018.
My themes for 2018 are infrastructure, banks, defense, biotech and traditional energy. Probably won’t over write any of it until the summer.
I hope our newer members post and share their market thoughts. You don’t have to ask Alan or Barry a question. Please just tell us about what you are doing! Best regards, – Jay
“I am surprised – OK, shocked – at how well the market has started 2018”
Jay – Yep, it was unexpected but in context, only 5% better than the average since 2009 (a 2+2 trick) and less than the annual return in 2009 and in 2013. 9 straight years of market gains. I wonder if those new to the market since 2009 think that it’s always like this and is always going to be like this? I don’t believe it’s doom and gloom time quite yet but “Protect Your Cities” may be in order.
Spin,
Whenever you do think it is doom and gloom time please tell us since, because of your wealth of market experience, I will be all ears like in the old E.F. Hutton commercials :).
The market is an hour from the open on this cold winter morning in New Orleans. We don’t have to wrap pipes and let them trickle very often but did this week. We have a jobs number this morning and that has tended to lift the market in recent months no matter what the expectations were.
A pleasant weekend to all and unless your favorite team is Carolina Geaux Saints! – Jay
“When E. F. Hutton talks, people listen.” Yep Jay, you and I are antiques.
As for doom and gloom, I’m currently looking at implementing laying off some of the risk while still having some upside participation. It has been a nice 9 year run and it could very well continue for a bit. I suspect that the recent new tax law should propel the market higher in 2018 but I don’t make predictions or fixate on opinion, either mine or the talking heads on CNBC or the like. Go with the flow, eh?
Have a good weekend and good luck to your Saints.
Spin
Ellen,
In overwriting those stocks you have had for many years, have you had any surprises or had any calls assigned? Have you had to buy back any calls to avoid getting assigned? Do you avoid Ex-Dividend date periods and make sure you do not have any call written at that time?
Mario
Marsha,
The BCI methodology is for conservative investors.
I am very conservative, and use this method for monthly income.
I buy/write each month, right after expiration weekend, and normally stay near the money, choosing strikes that will give me ROO of 2% minimum, and 3% max.
My resoning is that when the market makers are offering more than 3% ROO NTM in 4 weeks, they believe that the underlying stock is very volatile, and this represents a red flag to me.
Roni
Marsha,
I published my YTD Performance Chart for 2017 on Dec. 21, 2017 Blog. I keep track of 4 accounts at Fidelity and Etrade as one total.
You can quickly see my results find it by using the Search feature of this web site. Search for
” dec 2017 4 accounts portfolio arbitrage ”
or also by searching for
“dec 2017 4 accounts portfolio Mariog ”
It is in the Arbitrage Part 1 blog thread near the end on Dec. 21 at 9am.
.*******
Four 4 Accounts Portfolio (24.88% annualized):
Here is a quick summary:
Period covered 12/16/16 to 12/15/17 Expiration dates (Full 12 months)
2017 Full year Annualized performance 24.88%:
Each account broken down:
Fidelity – Act16 36.1%
Fidelity – Act91 (IRA) 22.3%
Etrade – Act37 23.4%
Etrade – Act94 (IRA) 21.1%
I typically trade 5 to 7 covered calls in each account. I tend to trade in the ITM conservative side and go OTM less often but sometimes follow the ratio Alan recommends. I also do get 92% or better each month.
You can tell from the Excel chart I posted that my monthly gains during the 12 months had a minimum of -0.7% to a maximum of 5.58%.
In 2016, over a period of 8 months after joining Alan’s methodology, I had an annualized gain of 16%.
.*****
ETF ONLY PORTFOLIO – Currently 9.8% annuallzed:
I also posted the results of my ETF only Joint Trust account in the same blog on the same day. I posted on Dec. 21 an annualized performance of 4.77% for a working period of 8 months. The ETF portfolio is currently doing through 12/29/17 6.8% YTD (8 months) or 9.8% annualized (extrapolated to 12 months) – double what I just posted last month. As I always state, much better than a 1.25% CD rate that we had for the last several years before i retired.
Good luck.
Mario
Alan;
Greetings and Happy New Year to you, your family and staff;
I’ve enjoyed the knowledge gleaned from your Covered Call, Exit Strategies and CS Puts books.
While Secured PUTS are still somewhat new to me, I saw a situation this week I must ask about.
MSFT is my ticker example. (I hope this explanation comes out properly!)
I’ve STO two PUTS at an 83 strike while the daily price has been in the $85 range. The first was STO on 12/11 and BTC successfully on 12/29 for final premium of $33.05.
On 12/26 I STO another PUT at $83. Today (1/4) the stock is up to $87.28. This may be “Hitting a Double”?
My question involves the upcoming Earnings Report on 1/25 with Earnings Whisper showing a 5 up and 1 down indicator for the ER result. With such indicators about the upcoming ER and possibility for the stock to rise even more, or stay above my strike price (this PUT expires on 1/19), do you see this situation as too risky to STO a PUT that is open during the earnings report period?
I’ve not seen a situation like this before, and expect I could sell PUTS all year and not see this again. With MSFT being a quailty stock, I must ask “What Would Alan Do”? Is this an opportunity, or sit out the ER period before you’d sell another Put here?
I appreciate the information you share with myself and those who follow your work.
Thank You
Jim
Jim,
Thank you for your generous comments.
Hitting a Double” with puts: Yes, when stock price rises, put value declines. Use the 20/10% guidelines for puts to potentially “hit a double”
Earnings reports: Covered call writing and selling cash-secured puts are conservative option-selling strategies. By incorporating an earnings report into the equation, we are elevating the level of risk despite what certain vendors may predict. In the BCI methodology, there are many guidelines that increase the opportunities for success. The reason I frame these as “guidelines” is that it gives flexibility to our members to trade within the framework of our personal risk tolerance. There is one rule…the earnings report rule. Although there will be more positive than negative surprises, when we lose, we can lose big. I learned this the hard way back in the 1990s. I don’t want this for our members.
Even when a report “beats” market consensus, it may not beat the “whisper number” Even if it does beat both consensus and the whisper number, it may reflect negative guidance moving forward. One “miss” can wipe out all option-selling gains for the month or worse.
MSFT has Weeklys. We can write Weeklys and just skip the week when the report will be published.
Alan
Alan, when there are fewer stocks than normal that pass all the BCI criteria, is that a concern? Does that mean that in general the stocks are not performing as well as they did?
William,
Yes, excellent observation. We have noticed over the past 10 years that the number of securities that pass the rigorous BCI screens is reflective of the current performance of the over all market. Our team has on its “to-do” list the creation of a market grader where we can statistically or graphically give an overview of the health of our stock market.
That said, even when the number of securities dwindles due to a bear market environment, there are always enough candidates available to populate most portfolios even if we have to use a combination of stocks and ETFs.
Alan