Diversification is one of the key common-sense requirements when selling covered calls or cash-secured puts. When using individual stocks, the BCI guidelines are a minimum requirement of 5 different stocks in 5 different industries where any one position cannot represent more than 20% of our entire portfolio. We can use fewer securities when using exchange-traded funds (ETFs) which are baskets of stocks that offer greater diversification. Some ETFs offer greater diversity than others. For example, the Vanguard 500 Index Fund (NYSE: VOO), has 500 underlying stocks baked into one security. In April 2018, Paul wrote to me about a strategy he wanted to implement using his 1800 shares of VOO. His goal was to generate additional income, continue to collect the dividends generated from these securities and avoid option exercise. This article will highlight potential returns and management approaches to this covered call writing-like strategy I refer to as Portfolio Overwriting.
Factors to consider when covered call writing on one broad-market ETF
- Set a return goal
- Use only out-of-the-money strikes to allow for share appreciation and minimize assignment risk
- Avoid earnings reports when applicable (not applicable with VOO)
- Avoid ex-dividend dates (ex-dates) to reduce risk of early assignment
- Be prepared to roll options if the strike is in-the-money at expiration
Setting return goal
The higher the annualized return goal, the closer to at-the-money will be the strike selected. We will select option strikes based on this goal and go as deep out-of-the-money as possible to achieve this target. Frequently, we may have to use a combination of strikes to achieve our objectives. For purposes of this article, we will set our goal as an additional 6% per year using out-of-the-money strikes.
VOO option chain for May 18, 2018 expiration (18 calendar day return)
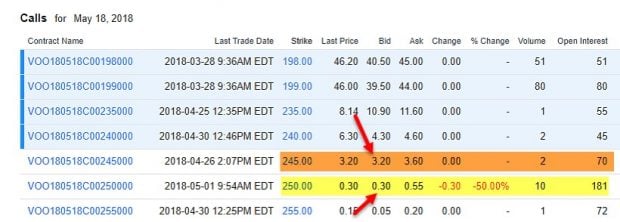
VOO Option Chain for 18-Day Returns
With VOO trading at $241.37, we will look at the out-of-the-money $245.00 and $250.00 strikes which generate bid prices of $3.20 and $0.30 respectively.
Calculations using the BCI Portfolio Overwriting Calculator
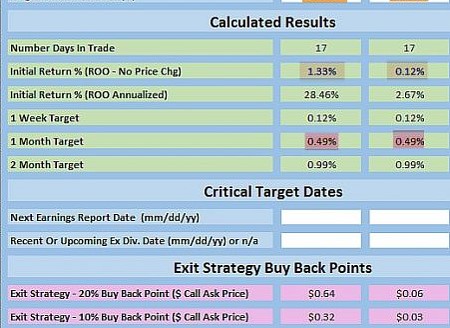
VOO Calculations using the BCI Portfolio Overwriting Calculator
With a 6% annualized target (gold cells), we are looking for a monthly return of 0.49% (pink-highlighted cells). The 2 strikes being evaluated show initial returns of 1.33% and 0.12% (gray-highlighted cells). To achieve our target goal of 6%, we can sell a combination of these 2 strikes using Paul’s 18 contracts:
- Sell 6 contracts of the $245.00 strike (6 x 1.33% = 7.98%)
- Sell 12 contracts of the $250.00 strike (12 x 0.12% = 1.44%)
- Average 18-day return = (1.44% + 7.98%)/18 = 0.52%
Since the trades are less than 1 full trading month, we have set up a reasonable approach to target an annualized return of 6% above previous portfolio returns.
Earnings reports and ex-dividend dates
VOO is a security that does not report earnings. The next projected ex-date is 6/26/2018 so the options to be sold for the July contracts should be on or after the ex-date.
Contract expiration results
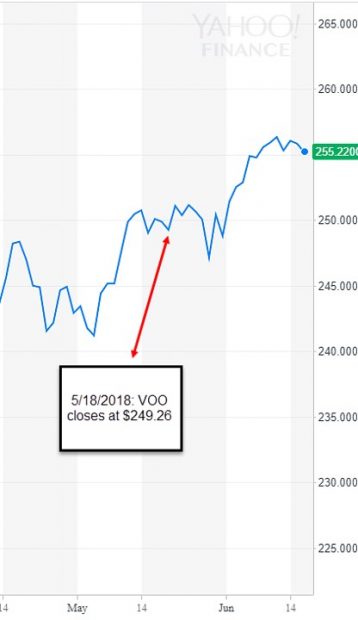
VOO Price at Expiration of May 2018 Contracts
- The 6 contracts with a $245.00 strike must be rolled out or out-and-up to avoid option exercise and retain the shares
- The 12 contracts with a $250.00 strike expired out-of-the-money so no action was required
Discussion
Adequate covered call writing diversification can be achieved using broad market ETFs. When our strategy goals include generating cash flow and higher portfolio returns while retaining our underlying security, we will set a target return objective and use only out-of-the-money strikes. Averaging multiple strike price returns is another tool we can use to achieve our goal.
Price reduction on all hard-copy DVD Programs
As we move from hard-copy to streaming DVD Programs, we will no longer be producing physical DVDs and workbooks. All will be available online moving forward. As a result, we are reducing the pricing for the remaining supply to that of the streaming copies and hard copies will be available until the supply runs out (not much left now). I wanted to make these available to our premium members first. Here are the new prices:
- Covered Call Writing 4- DVDs + Workbook: $99 (was $395)
- Selling Cash-Secured Puts 2 DVDs + Workbook: $49 (was $125)
- Exit Strategies for Covered Call Writing 2 DVDs + Workbook: $49 (was $125)
Upcoming event
AAII National Investor Conference: Las Vegas Nevada
October 26 @ 8:00 am – October 28 @ 1:00 pm
October 26th – 28th, 2018 (Friday through Sunday)
Alan’s presentations: Saturday October 27th at 9:30 AM and 1 PM
Visit Alan, Barry and the BCI team in the exhibit hall Friday, Saturday and Sunday
Market tone
This week’s economic news of importance:
- Markit manufacturing PMI September 55.6 (55.6 last)
- ISM manufacturing index September 59.8% (60.3% expected)
- Construction spending August 0.1% (0.4% expected)
- ADP employment September 230,000 (168,000 last)
- Markit services PMI September 53.5 (52.9 last)
- ISM manufacturing September 61.6% (58.3% expected)
- Weekly jobless claims 9/27 207,000 (213,000 expected)
- Factory orders August 2.3% (2.2% expected)
- Non-farm payrolls September 134,000 (168,000 expected)
- Unemployment rate September 3.7% (3.8% expected)
- Average hourly earnings September 0.3% (as expected)
- Trade deficit August -$53.2 billion (-$53.7 billion expected)
- Consumer credit August $4 billion ($17 billion last)
THE WEEK AHEAD
Mon October 8th
- None: Columbus Day
Tue October 9th
- NFIB Small Business Index September
Wed October 10th
- Producer Price Index September
- Wholesale Inventories August
Thu October 11th
- Weekly jobless claims 10/6
- Consumer Price Index
- Core CPI September
- Federal Budget September
Fri October 12th
- Import Price Index September
- Consumer Sentiment Index
For the week, the S&P 500 moved down by 0.97% for a year-to-date return of 7.93%
Summary
IBD: Uptrend under pressure
GMI: 4/6- Bullish signal since market close of July 9, 2018
BCI: Selling an equal number of ITM and OTM strikes for new positions. Taking advantage of all exit strategy opportunities with recent market volatility
WHAT THE BROAD MARKET INDICATORS (S&P 500 AND VIX) ARE TELLING US
The 6-month charts point to a neutral-to-slightly bullish tone. In the past six months, the S&P 500 was up 9% while the VIX (14.82) down by 22%.
Wishing you much success,
Alan and the BCI team
Alan,
I have a question on Exit Strategy “Hitting a Double”.
The first step in this strategy is to buy back the option.
The second step in this strategy is to wait for the stock price and option value to rise within a short period.
1. What time frame is short period of time? Example: Within few days? Within few weeks?
2. Wait for the stock price to rise back to what price?
Thank you!
Byung
Byung,
To master the “hitting a double” exit strategy (Plan A related to your inquiry), we must understand the impact Theta (time value erosion) has on the time value component of our option premiums (see the screenshot below). The strategy is best implemented in the first half of our option contracts when there is still significant time value remaining. If share price rebounds, our goal is to generate more time value profit than the cost-to-close. We are limited by Theta and therefore will re-sell the option as time is “running out” As a guideline, I would wait up to 10 trading days prior to expiration of a Monthly contract. At that point, we have Plan B and Plan C ready to go…”rolling down” or selling the stock.
If we buy-to-close at $0.15, we can sell-to-open at a profit within the time frame I alluded to. That can be $0.,25, $0.50, $1…any amount that will put additional cash in our pockets.
In the screenshot, “hitting a double” is best executed in the yellow field, while “rolling down” in the brown field. Selling the stock can be implanted at any time if share price continues to move down and is under-performing the overall market.
CLICK ON IMAGE TO ENLARGE & USE THE BACK ARROW TO RETURN TO BLOG.
Alan
Hello Byung,
I have 3 real life examples from last week market downturn for you:
PAPL, PANW, and GRUB.
On Thursday and Friday I bought back the 10/19 expiry calls at 20% of the value received.
Now my shares are free of the obligations, and I must take my next steps.
Today my paper loss is aprox. 4% on each ticker, and if it continues to deteriorate in the next couple of days, I will probably sell at a realized loss.
My limit loss is aprox. 8 – 10% on each single ticker.
PYPL has changed ER date to 10/18, so I may wait a few more days to see if it recovers before liquidating, and may even take it through ernings, but I will not sell any calls before 10/18.
GRUB has ER scheduled for 10/24, so I may sell new, lower strike 10/19 calls to reduce my loss.
If it recovers significantly I may be able to “Hit a Double”, who knows?
PANW has ER scheduled for 12/06, so there are plenty of possibilities available.
So, you see Byung, it all depends on each individual stock and it’s situation.
Roni
Byung – good answers by Alan and Roni.
Next step after filling the 20% rule with a BTC is to set up a new STO order GTC so it will execute automatically should the price spike back up to your original underlying price and sold the call. Things can happen on market open or during the day and you don’t want to miss an opportunity to hit the double.
What value to set for the new STO order? I usually look at the current ATM premium to determine approximately the decayed premium will be when my price recovers.
For example on 10/4, EWW filled a Strike 51 BTC 20% rule for a premium of 0.25 (underlying price at that time was 49.20). I had sold the original call at an underlying price of 51.175 on 9/27 strike 51 for a premium of 1.231 (20% = 0.25).
I then checked what the premium was for a ATM strike of 49 and noticed it was 0.93/0.99. I then set up a new STO order for strike 51 at 0.90 GTC. This is a good approximation. As the price recovers I can readjust this value based on the actual premium I see, the current Delta, and price goal (51.175).
Mario
Clearly understood.
For this exit strategy, do we take Market Tone into consideration?
Thanks
Byung,
Yes, we always factor in market tone. After closing the current position, market tone will dictate the stock and option we choose for the 2nd income stream.
Alan
Premium Members,
This week’s Weekly Stock Screen And Watch List has been uploaded to The Blue Collar Investor Premium Member site and is available for download in the “Reports” section. Look for the report dated 10/05/18.
Also, be sure to check out the latest BCI Training Videos and “Ask Alan” segments. You can view them at The Blue Collar YouTube Channel. For your convenience, the link to the BCI YouTube Channel is:
http://www.youtube.com/user/BlueCollarInvestor
Best,
Barry and The BCI Team
barry@thebluecollarinvestor.com
Not many stocks on the running list this week.
Terry,
If you notice on the first page of the report, the Put/Call Ratio was 1.06. Per IBD…
Psychological Market Indicators»
Put Call Ratio
A contrarian sentiment indicator that helps determine major and short-term market bottoms. The Put/Call Volume Ratio compares the total number of puts traded each day with the total number of calls. The ratio will surge above 1.0 when investors turn bearish and buy more puts than calls. A reading above 1.15 can confirm a positive reversal in the S&P 500 or Nasdaq, or follow-through day.
1.06 as of 10/5/2018
Just watch your trades and use your exit strategies as necessary.
Best,
Barry
Barry;
Yes I can relate to readings on the VIX.
VIX above 15 flashing caution, above 20 flashing danger.
Best;
Terry
Terry,
We have found, over the years, that the number of stocks on our running list is an excellent indicator on what has happened in the market in the past 5 trading days. Most of the stocks that were “bumped” from last week’s list were done so for technical analysis reasons. If we have a market rebound this week, it will be reflected in a more robust running list next week.
Alan
In your example you used VOO. Why wouldn’t you do the same thing but with SPY? SPYs options have much more open interest and daily volume. Both ETFs are back by the S&P 500 and are almost the same.
Ken,
You bring out a great point with SPY and option liquidity.
The article is a response to Paul’s email to me where he used VOO. Some reasons why an investor may use VOO include:
1. Lower expense ratio than SPY (0.04% compared to 0.09%).
2. No trading commissions if trading VOO in a Vanguard account.
Alan
Hello Alan,
I have a question. I am reviewing the weekly report and I have selected my stock. Do I have to wait until the markets open to see the current option prices? When is the better time to get my portfolio together to review?
Thanks
Harry
Harry,
90% of our portfolio preparation can be accomplished evenings and weekends. Option pricing can be estimated off-hours but we must re-checked when markets are open.
The best time to set our monthly portfolios is in the first day or two of the new contracts (Monday or Tuesday after expiration Friday). I also prefer to set my trades between the trading hours of 11 AM to 3 PM ET to circumvent early morning and late afternoon institutional computerized trading. Exit strategies should be executed at any time when those opportunities present themselves.
Alan
Thanks Alan. Also, do you set your monthly portfolio up from previous month’s reports, or from each week as they come out?
Thanks again
Harry,
Let me add this to Mario’s outstanding response:
The report that is published immediately after expiration Friday is best used to establish our Monthly portfolios. The subsequent weekly reports are best used if a replacement stock is needed during the monthly contract. Of course, weekly reports are also used by members who use Weekly options.
Alan
Harry,
Though Week 1 – 2 are preferable for the higher time value to initiate your covered call trades, any time, anytime you can meet your Return goals is ok to place a trade. That is why BCI publishes a new run list each week with current higher quality choices.
What I found out recently with an actual experience, is that the reason a stock may pay a high return in the latter weeks is because of a high Implied volatility (IV in option table), not the time value component. That may deter you from investing in a particular stock or at least research further the industry, analyst ratings etc. The time value or Extrinsic value of a premium is composed of a Time component and a volatility component.
I purchased MJ last month and after trading it the price when south against me but by expiration date it was profitable. I looked further into the volatility IV and it was over 60%. First time that has come up in 3 years of trading. The crazy thing is that it is an ETF (listed in ETF report), so being an ETF does not imply low volatilty. I have not traded that ETF further because of this because of my risk tolerance. All my other ETF have a volatiltiy below 30 (listed at the end of the ETF report) so that probable price fluctuations are lower within an option cycle.
Mario
Alan,
We have not connected in a little while. I have a question for you in terms of performance on the back of the strategies that you employ (writing covered calls, selling cash secured puts, etc) and their respective returns on a risk adjusted basis.
In terms of generating the passive income that will allow me to attain financial freedom I would require a return of 5% a month. If you examine your strategies, their performance, and perhaps back test over say the last 10 years, do you feel that this is an attainable goal? Attainable not only in the current market state, but also something that can be modified on a go forward basis to account for the various market nuances that history throws our way.
I thank you very much for taking the time to answer my question, your consideration is very much appreciated.
Milan
Milan,
Covered call writing and selling cash-secured puts are low-risk, conservative strategies. They allow us to beat the market on a consistent basis because selling options lowers our cost-basis.
5% profits per month (60% annualized) is not achievable with these strategies. In 25 years of selling options, I’ve come close once or twice but those years were aberrations. Any strategy that aspires to return 60% annualized returns is a highly risky strategy where losses can be catastrophic. Don’t be fooled by those who tell you otherwise.
These strategies are best suited for investors willing to incur low-risk and aspire to beat the market on a consistent basis. This along with compounding may be enough to achieve our goal of financial independence.
Alan
Correction pain
I’ve bought back most of my 10/19 CCs.
Now switching to damage control.
Roni
The battle goes on.
I have bought back 10 of my 11 CC contracts, and waiting for a possible rebound. Who knows?
On the other hand, we must not wait too long before the losses become unbareable.
Therefore I will begin to liquidate the worst ones, and or sell lower CCs against some of the others, plus maybe I will consider taking the strongest ones through the upcoming earnings reports, which I beleive will be mostly positive due to the strong American economy in the recent quarter.
Good luck to everybody – Roni