Option Greeks are mathematical means of measuring the risk of stock options. One of the least discussed of these factors is Gamma. In this article, we will explore the significance of this Greek and relate it to covered call writing.
Gamma defined and explained- Second order price sensitivity
Gamma is an estimate of how much option Delta will change for every $1.00 change in the price of the underlying security. It is stated in terms of Deltas per dollar change. It will be a number between 0 and 1.00 since Delta cannot be greater than 1, neither can Gamma. Only options have Gamma as stocks will have Deltas of 1.00 (long positions) or (-) 1.00 (short positions) and will not change. Some consider Gamma as “the Delta of Delta”.
Gamma example and calculations
Stock XYZ is trading at $48.00
$50.00 (out-of-the-money) call has a Delta of +0.45
$50.00 (in-the-money) put has a Delta of -0.55
Gamma for both call and put is .03
If XYZ increases to $49.00, the Delta of the call = 0.48; Delta of the put = -0.52
Note that both are moving closer to at-the-money strikes with Deltas closer to o.50 (plus and minus)
If XYX drops to $47.00, the Delta of the $50.00 call = +0.42; the Delta of the $50.00 put = -0.58
Here the call strike moves deeper out-of-the-money and the put strike moves deeper in-the-money.
This scenario assumes all other factors remaining the same.
Gamma and Put/Call Positions
Initially, these relationships can be a bit tricky so I created this chart you may be interested in printing out. Gamma position is influenced by the type of option position and the direction of stock price as shown in the chart below:
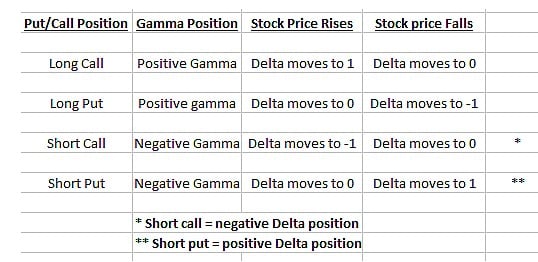
Impact of Gamma on Long and Short Call and Put Positions
“Moneyness” (relationship of strike price to stock price) of options:
Gamma is largest for near-the-money strikes and decreases the deeper in-the-money or out-of-the-money the strike moves. The deep-in-the-money options already have a high positive or negative Delta. If the options become deeper in-the-money, the Delta will move toward 1.00 for calls (or -1.00 for puts) and the Gamma will decrease because the Delta cannot move past 1.00 or -1.00. If the stock were to move toward the strike of the (now) deep-in-the-money option, the Gamma will increase and the Delta moves lower approximately by the amount of the current Gamma.
***Gamma and covered call writing
When we sell a covered call it is generally near-the-money so as to generate the initial returns we are seeking. Deep in-the-money or out-of-the-money calls have lower time value components than do near-the-money strikes. As a result, we are starting off with strikes that have Deltas near 0.50 with high Gammas (hang in there!). This explains why share price movement away from the strike will impact option premium to a greater extent initially than it will as the share price continues to move further away from the strike. This will lead to exit strategy opportunities such as hitting a double as our 20%/10% guidelines are met.
Discussion
Although Delta is one of the most important Greeks, the role of Gamma must be understood and considered when trading options. The impact that Gamma will have on Delta value is influenced by time to expiration, volatility of the underlying security (discussed in my Greek E-Book) and the moneyness of the option. Developing insight into these relationships will hone our skills as options traders and elevate our results to the highest possible levels.
Premium Members: Coming in July
The Blue Hour
The blue hour is the period of twilight during dawn each morning and dusk each evening when the sun is a significant distance below the horizon and the residual, indirect sunlight takes on a predominantly blue hue (typically 40 minutes in length).
The BCI team will use this theme to provide additional educational content to our members in the form of webinars, Q&A, interviews with experts and much more. Our initial 30 – 40-minute trial run will be held on July 28th at 9 PM ET in the form of a webinar with Q&A and additional comments. I will be hosting the webinar and Barry Bergman, the BCI Director of Research will be responding to your questions simultaneously. This event will be free to the first 50 premium members who sign up and will be recorded and available on the premium member site and free to all our premium members. We will be providing a series of these educational events to our premium members throughout the year. Our team is in the process of developing a landing and signup page for The Blue Hour and once ready we will open up registration. Ultimately, the development and format of The Blue Hour will depend on your suggestions and feedback such as Mario’s:
*************************************************************************************
Next live event
June 11, 2016
American Association of Individual Investors
Research Triangle Chapter
Raleigh/Durham, North Carolina
10 AM – 12 PM
Global equities moved up strongly this week as the market accepted the possibility of a rate hike from the Fed at either its June or July meeting. Stabilizing oil prices also played a positive role. The Chicago Board Options Exchange Volatility Index (VIX) declined to 13.12 from 16.08 a week ago. This weeks reports and international news of interest:
- The US economy grew slightly faster in the first quarter as GDP was revised upward to 0.8% annual rate
- According to the US Bureau of Economic Analysis growth in the second quarter looks to be improving, with estimates running near 2.5%.
- J.P. Morgan estimates its global composite purchasing managers’ index will decline to 51 in May suggesting that global growth would slow to 1.8%
- Greece will avoid another debt crisis with financial aid from the eurozone. The deal was reached between eurozone finance ministers and the International Monetary Fund
- Crude prices briefly surpassed the $50 mark this week before closing out the week slightly over $49
- A scheduled further increase in Japan’s sales tax may be delayed three years as many fear an additional tax hike could throw the Japanese economy back into recession
- Japan reports retail sales on Monday, May 30th
- The US and UK markets are closed on Monday, May 30th for Memorial Day and the Spring Bank Holiday, respectively
- Manufacturing PMIs are reported globally on Wednesday, June 1st
- Service sector PMIs are reported globally on Friday, June 3rd
For the week, the S&P 500 rose by 2.28% for a year-to-date return of +2.70%.
Summary
IBD: Market in confirmed uptrend
GMI: 5/6- Buy signal since market close of May 25th
BCI: Cautiously bullish but still selling an equal number of in-the-money and out-of-the-money strikes.
WHAT THE BROAD MARKET INDICATORS (S&P 500 AND VIX) ARE TELLING US


Premium Members,
This week’s Weekly Stock Screen And Watch List has been uploaded to The Blue Collar Investor Premium Member website and is available for download in the “Reports” section. Look for the report dated 05/27/16.
Be sure to check out the latest BCI Training Videos and “Ask Alan” segments. You can view them at The Blue Collar Investor YouTube Channel. For your convenience, the link to The Blue Collar Investor YouTube Channel is:
http://www.youtube.com/user/BlueCollarInvestor
Best,
Barry and The Blue Collar Investor Team
Alan,
You once gave a link for a free greek calculator. Can you let me know where to find it. I’m starting to understand how the greeks work.
Thanks,
Chris
Chris,
Happy to:
http://www.cboe.com/framed/IVolframed.aspx?content=http%3a%2f%2fcboe.ivolatility.com%2fcalc%2findex.j%3fcontract%3dD735A25F-3542-443D-9A38-842F0D74A34C§ionName=SEC_TRADING_TOOLS&title=CBOE%20-%20IVolatility%20Services
Alan
Running list stocks in the news: SIMO:
Silicon Motion Technology, a semiconductor company headquartered in Zhubei City, Taiwan, recently boasted a positive 12% earnings surprise and a 7.7% positive revenue surprise. In the past 7 quarters the company has beat estimates 6 times with “beats” ranging from 12% – 22%. The next scheduled earnings release is 7/27/2016.
Our Premium Watch List shows SIMO in the “Chips” industry currently ranked “B”, a Scouter rating of “10”, a beta of 1.08, a % dividend yield of 1.60, adequate open interest for near-the-money strikes and an ex-dividend date of 8/3/2016. Below is a current bullish price chart.
CLICK ON IMAGE TO ENLARGE & USE THE BACK ARROW TO RETURN TO BLOG.
Alan
Alan,
I had never heard of the stock so I looked it up. As you show, it has a beautiful chart. More astonishing is the options action: there are 1,694 June $45 call contracts open and only 10 on the put side.
How often to you see imbalance like that and does it give you cause for concern? – Jay
Jay,
Many would interpret the high open interest on the call side compared to the put side as investors taking a bullish stance on this stock. When superimposed over the stellar chart, it would appear that the high OI strikes were once out-of-the-money and now in-the-money which again would appear to confirm bullish positions.
For me, it’s difficult to make a meaningful assessment based on open interest (other than from a liquidity vantage point) because for every seller there’s a buyer and vice-versa. Also, share price at the time the option position was established would also have to be studied. Sooooooooo, I personally, do not try to make sense of call/put OI imbalance but rather make my decisions on fundamental, technical and common sense considerations.
Alan
Thanks for the always thorough and informative reply Alan.
Barry likely found another gem with SIMO, it’s up 2.5% today, over 5 times greater than the gain in the semiconductor ETF SMH. This might be one where if your portfolio can afford 200 shares you buy it and cover half letting the other half run. -Jay
Premium members:
This week’s 8-page report of top-performing ETFs and analysis of ALL Select Sector Components has been uploaded to your premium site. The report also lists Top-performing ETFs with Weekly options.
For your convenience, here is the link to login to the premium site:
https://www.thebluecollarinvestor.com/member/login.php
NOT A PREMIUM MEMBER? Check out this link:
https://www.thebluecollarinvestor.com/membership.shtml
Alan and the BCI team
Running list stocks in the news:EDU:
New Oriental Education & Technology Group is China’s largest private education provider and a member of our Premium Watch List for the past 14 weeks.
On April 19th, 3rd quarter earnings were reported boasting a 20.6% increase in revenues year-over-year with net income up 16.8%. Revenue guidance is in the 15% to 19% range, very impressive. Recently, Tencent, a leading internet company, invested $50 million in its online education platform.
Our Premium Watch List shows EDU to be in the Consumer industry segment currently ranked “B” , a Scouter rating of “10”, a beta of 0.79, a next projected earnings report on 7/19, adequate open interest for near-the-money strikes and a beautiful chart pattern as shown below. Check to see if this security deserves a spot in your portfolio.
CLICK ON IMAGE TO ENLARGE & USE THE BACK ARROW TO RETURN TO BLOG.