When we sell covered calls or cash-secured puts, we access option-chains to determine the value of the premiums we are selling. This article will highlight the factors that determine these prices and compare them to the prices generated by option pricing models like the Black-Scholes Pricing Model.
Factors that determine option pricing
- Consensus of all market participants (retail investors & professionals)
- Supply & demand (most important factor)
- Real value determined by what traders are willing to pay
- NBBO: National Best Bid and Offer: Regulation by the SEC that requires brokers to execute trades at the lowest “ask” price when buying securities and the highest “bid” price when selling securities
Option Pricing Models (Black-Scholes, binomial option pricing, and Monte-Carlo simulation etc.)
- Calculate theoretical option value
- Account for variables such as current market price, strike price, volatility, interest rate, and time to expiration
- The primary goal of option pricing theory is to calculate the probability that an option will be exercised or be in-the-money (ITM), at expiration
- Options pricing theory also derives various risk factors or sensitivities based on those inputs, which are known as the option’s Greeks
Real-life example with Intel Corp. (Nasdaq: INTC): Option-chain on 3/26/2024
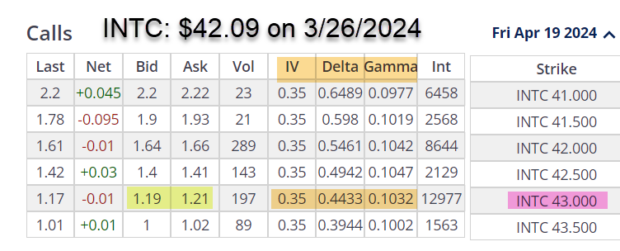
- 3/26/2024: INTC trading at $42.09
- 3/26/2024: The 4/19/2024 OTM $43.00 call (pink cell) shows a bid-ask spread of $1.19 – $1.21 (yellow cells)
- Implied volatility is 35%, Delta is 0.4433 and Gamma is 0.1032 (brown cells)
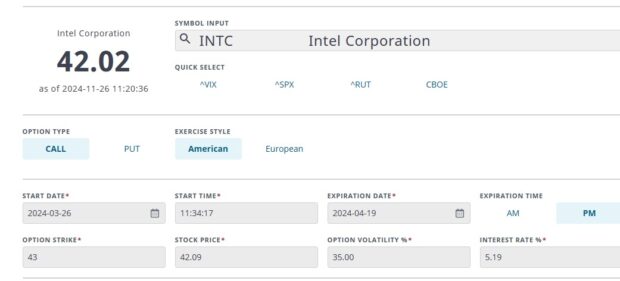
- These stats are placed into an Option Calculator like the one provided by the Options Industry Council (OIC)
Options calculator entries (from option-chain)
Option Calculator results
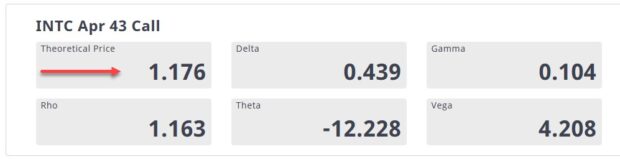
- Delta and Gamma stats are similar to those on the option-chain
- The theoretical value of the option is $1.176, less than the $1.19 – $1.21bid-ask spread
- Based on this data, it can be said that the current value of the 4/19/2024 $43.00 call option is overpriced
- It’s all about supply & demand
Discussion
Theoretical option values can be calculated using option pricing models. These are only guidelines. Real option value is determined by what traders are willing to pay for the option, and that is based on supply and demand. Market-makers will publish the NBBO, and these are the prices we pay or receive from our option trades.
BCI Trade Management System: Calculator, User Guide & Exit Strategy Book Package

(Video will not play from this screenshot. Click the link below to watch the video)
This is the only spreadsheet in existence that allows the user to enter covered call writing and cash-secured put trades, receive initial trade and portfolio calculations, execute > 20 exit strategy trade adjustments and then calculate final post-adjusted trade and portfolio results. This is an absolute must for all covered call writers and sellers of cash-secured puts.
Click here for more information and to order this product.
Your generous testimonials
Over the years, the BCI community has been incredibly gracious by sending our BCI team email testimonials sharing stories as to what our educational content has meant to their families. Moving forward, we have decided to publish several of these testimonials in our blog articles. We will never use a last name unless given permission:
Alan,
Thank you for the continued membership. The fact that you take the time to personally respond to emails is amazing. I appreciate you, the knowledge you’ve shared, the BCI methodology and your service to our country as a dentist, and as a teacher to our fellow blue-collar investors. I’m looking to acquire my first real estate property in NYC thanks to the over $100k I’ve accumulated in the last 3 years using the BCI methodology.
Thank you, Alan. I’ve recommended your products to quite a few people overseas.
Clare
MAJ. US Army
Upcoming events
1. Mad Hedge Investor Summit
Tuesday September 17, 2024
11 AM ET – 12 PM ET
Zoom webinar.
Portfolio Overwriting: Covered Call Writing Our Buy-And-Hold Stocks
Increasing profits and avoiding tax issues
Our buy-and-hold portfolios in non-sheltered accounts are generating 8% – 10% per year. Can we potentially increase these yields by selling stock options while, at the same time, dramatically decreasing the probability of our shares being sold to avoid potential tax implications? The answer is a resounding “yes”.
Portfolio Overwriting is a strategy that can benefit millions of investors seeking to enhance portfolio returns using a low-risk covered call writing-like strategy.
Traditional covered call writing will also be discussed to demonstrate comparisons between the 2 strategy approaches.
Topics discussed
Summary
Brief review of covered call writing
Option basics
What is an option-chain?
Option selection
Calculating covered call returns: Real-Life examples
Portfolio overwriting defined
Basics of strike selection
Pros and cons of portfolio overwriting
Why early exercise is so rare
Rolling options
Role of dividends
Locating ex-dividend dates
How to avoid early exercise
Avoiding earnings reports
Practical applications: Delta, implied volatility, annualized returns
Real-life examples with calculations
BCI Trade Management Calculator
2. Stock Traders Expo- live event in Orlando Florida
October 17 -20
- 2-hour Covered Call Writing Masters Class
- All Stars of Options class on Portfolio Overwriting
Details to follow.
3. American Association of Individual Investors/ Los Angeles Chapter
November 9, 2024
12 PM ET – 1:30 PM ET
Private webinar for members of this AAII investment club
4. Young Investors Club: University of Central Florida
Wednesday November 13, 2024
Private investment club
5. BCI-Only Webinar
Zoom
Thursday November 21, 2024
8 PM ET – (:30 PM ET
Covered Call Writing Dividend Stocks
Details & registration link to follow.
6. Long Island Stock Investor Group Part I
Zoom
February 13, 2025
7:30 – 9:00 ET
Details to follow.
7. Las Vegas Money Show
February 17 – 19, 2025
details to follow.
8. Long Island Stock Investor group Part II
March 13, 2025
7:30 – 9:00 ET
Details to follow.

Begin additional segments text here (like testimonials, events, etc.)

Premium members:
This week’s 5-page report of top-performing ETFs, along with our sample trade of the week, has been uploaded to your premium site. The Select Sector SPDR section is now crafted to align with our streamlined (CEO) approach to covered call writing. The report also lists Top-performing ETFs with Weekly options, mid-week market tone as well as the implied volatility of all eligible candidates.
We have also included a sample trade taken from one of our BCI watchlists.
Premium member video link:
https://youtu.be/EXMO-KwZuJs
For your convenience, here is the link to login to the premium site:
https://www.thebluecollarinvestor.com/member/login.php
NOT A PREMIUM MEMBER? Check out this link:
https://www.thebluecollarinvestor.com/membership.shtml
Alan and the BCI team
Premium Members,
This week’s Weekly Stock Screen And Watch List has been uploaded to The Blue Collar Investor Premium Member site and is available for download in the “Reports” section. Look for the report dated 09/06/24.
Be sure to check out the latest BCI Training Videos and “Ask Alan” segments. You can view them on The Blue Collar YouTube Channel. For your convenience, the link to the BCI YouTube Channel is:
https://www.youtube.com/user/BlueCollarInvestor
Reminder: Premium Member’s pricing is locked into your current rate and you will never see a rate increase as long as the membership remains active.
Please note that we have restored the large print section at the end of the weekly report.
Barry and The Blue Collar Investor Team
Good afternoon from Lima Perú!
I think there is an error in the note that cannot be ignored
As you can see in the photo itself, the last option sold or bought was 1.17, which is the theoretical price of the option according your Black Scholes Model
Likewise, it should be remembered that the BS formula is used to determine the implied volatility, and thus compare it with the historical volatility to the stock
Let me explain:::
The BS formula takes the price of an option, calculates its delta and its gamma and its theta, and then, the “remainder” is explained by the implied volatility
Therefore, the theoretical price of an option will always MATCH that of the market, if you put the greeks that the broker indicates to you
The important thing about the BS formula is that it allows you to know what the implied volatility of that option is, and thus compare it either with a volatility model of that stock or with the historical volatility of that same stock
Pablo,
Thanks for your feedback.
According to the Options Industry Council, option pricing models are used in two directions:
(Less common) Inserting an anticipated (or expected) IV level as determined by the user and calculating a theoretical (or hypothetical) value for the option. This would be a method used by an investor who is more speculative and involves a strategy where their selection of IV would challenge that of the open market. There are some professional firms that will take this approach, particularly when analyzing IV levels across expirations and looking for an outlier.
(More common) Inserting a known or observed option value and back solving for IV. Here, the user is calculating the IV level which justifies the given option price (e.g. last traded price, bid, ask, bid/ask midpoint, etc.). This IV level can then be used to perform further analysis such as comparing it to the historical levels of option IV for that stock aka “historical IV” to assist with trading decisions.
When it comes to the screenshots, it appears that the last traded price of 1.17 was possibly used to calculate a corresponding IV level of 0.35. If so, and with the current bid/ask at 1.19–1.21, the user could interpret in two ways:
There was a change in demand/supply causing an uptick in IV which isn’t accurately reflected in the screenshot because the 0.35 displayed is stale and based on outdated information (last traded price). This would not mean the option is overpriced.
Determine for themselves that 0.35 is their preferred level of IV to which they will base their analysis and, considering a higher IV level would be required to justify 1.19-1.21, the option might be considered overpriced.
I’ll clarify it’s difficult to draw a conclusion from the screenshot without knowing which value is being used to calculate an IV of 0.35.
Using the last sale price has significant limitations and is mostly irrelevant to where the option is now trading. Ideally, the displayed IV should be calculated using the bid/ask midpoint and constantly evolve as the spread of the option and the stock price move.
Alan
Alan or Barry,
Quick question on closing a rolling down trade before option expiration.
If I rolled down a trade for position management but decided to BTC the lower strike call and sell the stock, what method would you suggest in TMC for closing the position?
Would you use the original line, adjusting the credit for the #2 STO to reflect the debit for buying it back, and then use the same line to record the realized stock price?
OR
Would you carry the trade onto a second line in a way I am not thinking of, which may provide a better paper trail for recording the sale?
I appreciate the help you are providing while I learn.
BR
Joe
Joe,
Here’s how I manage these scenarios:
I adjust the 2nd STO credit reflecting the 2nd BTC. Enter the final stock price into the appropriate column and make an entry in the Trade Journal explaining the net option credit for the 2nd STO order.
This way, all trades are on 1 line, simplifying the process. It also allows for a complete and accurate paper trail.
Alan
Premium members:
This week’s 4-page report of top-performing ETFs, along with our sample trade of the week, has been uploaded to your premium site. The Select Sector SPDR section is now crafted to align with our streamlined (CEO) approach to covered call writing. The report also lists Top-performing ETFs with Weekly options, mid-week market tone as well as the implied volatility of all eligible candidates.
We have also included a sample trade taken from one of our BCI watchlists.
Premium member video link:
https://youtu.be/EXMO-KwZuJs
For your convenience, here is the link to login to the premium site:
https://www.thebluecollarinvestor.com/member/login.php
NOT A PREMIUM MEMBER? Check out this link:
https://www.thebluecollarinvestor.com/membership.shtml
Alan and the BCI team
Hi Alan,
I am looking at selling a CSP on ITB just for the 8 days remaining in the Sept contract. Currently trading at $119.90, my expected Delta move is -5 putting me on the $120.5 9/20 contract at $2.50 bid.
My question is the OI on this contract is 8. Does that matter in the
world of selling cash secured puts? The $120 shows over 2,270 OI and the $121 is 59. Goal one is collection of premium, but I am OK if I have to purchase as well and write a call on that purchase as goal two.
—
Thanks,
Dave
Dave,
Although the OI is only 8, the bid-ask spread is $0.20, more than acceptable for trading.
When we sell a put strike with a Delta of -5, there is an approximate 50% chance of exercise, barring any exit strategy intervention.
Alan
Alan –
Regarding the CEO strategy, how does the status of the market affect when you start the cycle?
Thanks –
-JEFF
Jeff,
We can use weekly or monthly expirations. I use both.
Weekly expirations start on Mondays and monthly expirations, the Monday or Tuesday after expiration Friday.
Market tone influences which strikes we select (ITM or OTM or a combination of both. I favor predominantly OTM except in extreme bear and volatile markets).
Alan