Whether we are writing covered calls, selling cash-secured puts or simply buying and selling stocks, the first important requirement is to develop or have access to a quality watch list of elite-performing securities. Once we have purchased a stock or exchange-traded fund (ETF), our goal is to make a profit. In this article, three approaches to generating cash will be explored using a stock from the BCI Premium Watch List as of June 2, 2016.
Real life price chart of EDU as of 6/2/2016

EDU- Chart
Note that since the short-term moving average (blue line) moved above the longer-term moving average (red line) at the brown marker, the price has doubled in about seven months. At this point there are three ways we can benefit from owning such a security:
1- Trailing stop loss order
In this case we remain share owners and do not use options. However, we do want to protect against significant share loss to the downside so we instruct our broker to sell the stock if it drops a certain percentage below its highest point, say 10% This is the figure I recommend in my book, Stock Investing for Students. With EDU trading at $42.70, the initial stop loss order would be at $38.51 or lower. Now if EDU moved up to $45.00, the stop loss order would move up to $40.50 ($45.00 – 10%). As share price moves higher, so does the stop loss order so upside is never capped but the downside is limited.
2- Write a covered call
This is my favorite strategy so let’s have a look at the options chain as of 6/2/2016 for the 7/15/2016 expirations:

EDU- Options Chain As Of 6/2/2016
The yellow highlighted area shows an initial return of $1.20 for the $44.00 call strike. Let’s check with the Ellman Calculator:
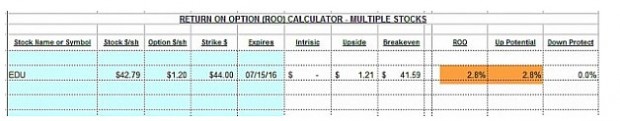
EDU: Covered Call Calculation
We see an initial 6-week return of 2.8% (ROO) and the possibility of another 2.8% (upside potential) if share price moves up to the $44.00 strike by expiration. There is a potential 5.6%, 6-week return…not bad. This return can even be improved if we “negotiate” a better bid price by leveraging the “Show or Fill Rule” perhaps generating $125.00 or $130.00 instead of $120.00 from the initial option sale.
Zero-dollar collar
A conservative way of managing covered call positions is to purchase a protective put to defend against substantial downside share loss. When the premium generated from the call sale negates the premium spent on the put purchase, the process is referred to as a zero-dollar collar. As an example taken from the option chain shown above, if we generate $1.20 from the sale of the $44.00 call and buy the $41.00 put for $1.20, the collar does not cost any money (perhaps commissions).
Advantages
- Protected against share loss below $41.00
- Protection is free
- Opportunity for share price to move up to the $44.00 call strike or 2.8%
Disadvantages
- Maximum gain is now 2.8%, not 5.6%
- Protection is good but not perfect as we can still lose $1.79 per share
Other collar combination strikes can be employed based on return goals and amount of protection desired.
Discussion
Whether we are simply buying and selling stock, writing covered calls or using the collar strategy, a high-quality watch list of securities is essential. From there. we must decide which approach for income generation will most closely be compatible with our trading style.
Upcoming live events
November 5, 2016
Plainview, New York
Saturday morning 3-hour workshop at the Plainview Holiday Inn. I am the only speaker and plan an information-packed presentation covering 5 actionable ways to make money or buy a stock at a discount using both call and put options. We will also evaluate the stocks you currently own for option-selling. Bring a list of stocks currently in your portfolio.
December 6, 2016
Options Industry Council Webinar Summit
Tuesday afternoon…1:30 Pm ET:
Those who register but cannot make the live event will be sent a link to the presentation recording.
![]()
Just added:
February 27, 2017
Stock Trader’s Expo
Marriott Marquis Hotel, NYC
1:30 PM ET
Exhibit hall Booth 208 (February 26th – 28th)…come say hi to the BCI team

Alan Speaking at The Stock Trader’s Expo
Market tone
Global stocks were modestly lower this week, as interest rates stabilized. Expectations are for a December rate hike from the US Federal Reserve. Volatility, as measured by the Chicago Board Options Exchange Volatility Index (VIX), rose to 16.19 from 14 a week ago. Oil prices declined this week. West Texas Intermediate crude fell to $49.25 from $51 last Friday. This week’s reports and international news of importance:
- Firmer economic data, particularly in Europe and the United Kingdom, helped extend the recent move higher in most global bond yields
- The Citigroup Economic Surprise Index, which measures how economic data fares relative to expectations, has shown a positive trend, as both the eurozone and the UK have held up well in the wake of the surprise Brexit vote in June
- German 10-year bunds are solidly in positive territory
- UK 10-year gilts are at post-Brexit highs of 1.26% after strong Q3 GDP data
- The US 10-year yields are trading near 1.85%, the highest level in four months
- The US had its best quarter of economic growth in two years in the third quarter, according to data released by the Bureau of Economic Analysis. The economy expanded at a 2.9% annual rate, boosted by a rise in inventories and on a narrower trade deficit
- Consumption, which had kept the economy afloat in prior quarters, was soft in the 3rd quarter
- The eurozone manufacturing PMI rose to its own 30-month high at 53.3
- Despite the upbeat data, inflation remains below the European Central Bank’s 2% target. The ECB is expected to extend its quantitative easing program for six months at its December meeting
- Data released Friday showed that the French economy expanded 0.2% versus the prior quarter, while Spain grew 0.7%
THE WEEK AHEAD
- Daylight-saving time ends in the UK and Europe on Sunday, October 30th
- Eurozone GDP and CPI numbers are released on Monday, October 31st
- The core PCE price index—the US Fed’s favorite inflation measure—is released on Monday, October 31st
- The Bank of Japan meets to set interest rates on Tuesday, November 1st
- Manufacturing PMIs are released globally on Tuesday, November 1st and Wednesday, November 2nd
- The Fed’s rate setting committee meets on Wednesday, November 2nd
- The Bank of England meets to set interest rates on Thursday, November 3rd
- The US employment report is released on Friday, November 4th
For the week, the S&P 500 declined by 0.69% for a year-to-date return of +4.03%.
Summary
IBD: Uptrend under pressure
GMI: 4/6- Sell signal since market close of October 12, 2016
BCI: I am currently favoring in-the-money strikes 2-to-1. It appears that institutional investors are expecting a Clinton victory which would then result (if my assessment is correct) in a stable market response. Those who expect a Trump victory may want to take a more defensive posture than I have.
WHAT THE BROAD MARKET INDICATORS (S&P 500 AND VIX) ARE TELLING US
The charts point to a neutral to slightly bearish outlook. In the past six months the S&P 500 moved up by 3% while the VIX rose by 5%.
_____________________________________________________
Wishing you the best in investing,
Alan (alan@thebluecollarinvestor.com)
Alan,
I think in terms of time horizon for watch lists. For short term option trading between earnings reports there is no better list than the one you and Barry provide.
It is often tempting to convert your picks into longer term holdings but that is not their design. They have already had a run up to make your list. All we want is for it to last until next earnings report.
Longer term watch lists should have an element of poverty and hunger to them: my New Orleans Saints this season come to mind :). By that I mean you want good fundamental stories out of favor at the moment to employ longer term strategies on.
Those two watch lists can and should co-exist as a function of time expectations.
We have worn out the election on our comment board here :). But once past the stylistic differences and enmity between the two candidates they both talk about spending a lot of money on the same two things: Infrastructure and Defense. Those are likely two pretty good fishing holes to be working right now.
But how many Infrastructure and Defense stocks were on this week’s list?
None! Why? Because they have not happened yet. So they make little sense for a thirty day trade. But they sure do for something longer term.
I am looking at the stocks held in ETF’s like TOLZ, XLB and ITA for Poor Person’s covered calls and cash secured puts that may do fine regardless of and beyond Nov. 8th. – Jay
Hi Jay,
Both candidates talk about Infrastructure and Defence spending, but will they get approval from Congress ?
Roni
Hey Roni,
Do you have an outside the US ETF you like these days?
We have a baseball event going on we call “The World Series”. It is an embarrassing title just like our “Super Bowl” because we do not invite other countries.
It would be like if “The World Cup” of soccer or “Olympics” was held exclusively in one country inviting none other.
Please forgive our narcism often extending to the market. – Jay
No sweat Jay,
some sports are so big in the US, and most other countries are barely aware of them.
Here in Brazil for example, Baseball, American Football, and Golf, are not shown on normal TV, except for a minotity who has cable and satelite.
I personally like to see Nascar races, but most Brazilians watch only F1 races on Sunday mornings.
Soccer takes up 90% of sports TV time here.
To answer your question, I do not have any preferred ETFs outside the US.
I really do favor trading stocks of American companies, and selling covered calls, because their ROO is generally higher.
Be good – Roni
Jay,
There are many theories out there regarding stocks that have enjoyed a bullish run none of which are perfect or work all the time. As you know, William O’Neil built a company (Investor’s Business Daily) promoting companies that have achieved 52-week highs. Here is a link to a related article:
http://www.asxmarketwatch.com/2011/11/the-truth-about-trading-with-the-52-week-high-can-you-still-profit-and-does-it-still-work/
I’m sure there are other perspectives.
I included longer-term investing with the 10% trailing stop loss order caveat in this article because many of our members are using these reports in this manner, many successfully based on the feedback I receive.
Looking at stock ownership without the options element from the perspective of the “Greeks”, we are incurring more market risk. That is because our portfolios will have a higher Delta value than if we also sold calls, which would lower the Delta and therefore decrease market risk. This tells us that using our lists of top-performing stocks and ETFs will work best in a bull market environment…I didn’t need to tell you that.
That said, the IBD 50, a list we use as a staple in our stock screening process, has out-performed the S&P 500 over many years since its inception.
Our BCI lists were developed for short-term option-selling but can also be crafted for use in other trading strategies if proper precautions are taken like the 10% trailing stop loss orders depending on the strategy employed.
Alan
From this week’s Investors Business Daily
CLICK ON IMAGE TO ENLARGE & USE THE BACK ARROW TO RETURN TO BLOG
Thanks Alan,
I agree with your comments and hope I did not suggest anything to the contrary!
As you say, the BCI lists were developed for short-term option sales but can be crafted for many other uses. In the past I have used them for pure call buying speculation, stock ownership with and without covered calls, cash covered put sales and most recently selling OTM put credit spreads needing only the trade margin in my IRA..
All of those, as you know, are bullish applications. I have yet to bet AGAINST a stock on a BCI list :)!
What I was suggesting is that to get onto lists like the IBD 50, the IBD Big Cap 20 and BCI a stock must have shown recent strength in a variety of thoroughly back tested parameters that all make perfect sense.
More contrarian methods look for sectors that have longer term prospects but have fallen out of favor. Yet they may have new catalyst for recovery like an election or a shift in social or consumer trend before it shows up in the charts.
Critics of those strategies created the painful mental image of trying to “Catch the falling knife” to describe them 🙂 – Jay
Jay,
Thanks for sharing your perspectives. That’s what this site is all about…sharing information and learning from each other.
Alan
Alan,
I always learn something important in your weekly article.
The “Zero-dollar collar” lesson is very apreciated, especially in moments like this week.
We have: earnings season, election worries, FED watch, oil oversupply, etc., and my survival instinc tells me to stay in cash. But precious time and opportunities will be missed.
So now I can search for elite stocks, and, using the zero-dollar collar, I can get fully invested with low risk in November option contracts.
Also, this strategy will help me to raise my limits, and trade some high priced elite stocks.
Thank you Alan.
Roni
Roni,
Glad to help. About a year ago, I started including the “zero-dollar collar” into many of my live seminars and the information has been well received with positive feedback. It benefits us most in volatile and bearish market conditions.
Alan
Premium Members,
This week’s Weekly Stock Screen And Watch List has been uploaded to The Blue Collar Investor Premium Member site and is available for download in the “Reports” section. Look for the report dated 10/28/16.
Also, be sure to check out the latest BCI Training Videos and “Ask Alan” segments. You can view them at The Blue Collar YouTube Channel. For your convenience, the link to the BCI YouTube Channel is:
http://www.youtube.com/user/BlueCollarInvestor
Since we are in Earnings Season, be sure to read Alan’s article,
“Constructing Your Covered Call Portfolio During Earnings Season”. You can access it at:
https://www.thebluecollarinvestor.com/constructing-your-covered-call-portfolio-during-earnings-season/
Best,
Barry and The BCI Team
Running list stocks in the news: SCHW:
Charles Schwab is a company projected to benefit from expected interest rate hikes moving forward. Investment brokers use uninvested client cash to purchase ultra-short-term securities which should generate higher returns as rates rise.
In addition, analysts have been upgrading earnings and revenue projections for both the upcoming quarter and year. EPS growth for the quarter and year now stand at 33% while double-digit growth for revenues is expected. Charles Schwab now boasts 6 straight earnings “beats”
Our premium member “running list” shows a current price of $31.89, an IBD 50 rank of “31”, located in “Finance” industry ranked “A”, a beta of 1.86, a % dividend yield of 0.90, next earnings release date on 1/16/2017, Weeklys are available, adequate open interest for near-the-money strikes and the next ex-dividend date on 11/9/16.
The current chart below shows a 10% rise in price since the moving average crossover in early August.
CLICK ON IMAGE TO ENLARGE & USE THE BACK ARROW TO RETURN TO BLOG
Alan
Next Blue Hour Webinar (free to premium members):
December 1, 2016 @ 9 PM ET and recorded for premium members.
My team is preparing the landing page of information and the registration link as well as a product link in the store for general members. In the interim, I’ve uploaded the course outline and landing page information. Premium members login and scroll down on the right side.
CLICK ON IMAGE TO ENLARGE & USE THE BACK ARROW TO RETURN TO BLOG
Alan
Alan,
I’m a recent premium member and impressed with all the information in the stock report. My question is about beta. What is the significance of this number and how should I use it in my decisions? Thanks for your help.
Marie
Marie,
Beta is a secondary parameter to consider in the BCI to a market benchmark over a specific time frame. In our weekly reports, we use a 1-year time frame and the S&P 500 as a benchmark. Other resources use longer time frames and perhaps other benchmarks. If a stock has a beta of 1.5 and the S&P 500 moves up 4%, the expected movement of the stock would be 6%. If the S&P 500 moved down 4%, the stock is expected to move down 6%.
I put more emphasis on implied volatility (forward-looking) rather than beta (historical). IV is figured into our returns so I usually look for a 2-4% initial 1-month return in my account and 1-2% in my mother’s. This is how I measure implied volatility.
Now, if all things are equal and we are deciding between a few stocks, low-beta stocks out-perform in bear markets and high beta stocks outperform in bull markets.
Alan
Alan,
I use covered call writing in my ira account. Should I be worried about the new Department of Labor law that kicks in this April?
Thanks,
Mario
Mario,
For those of us trading with online discount broker accounts there appear to be no changes. The use of covered call writing in sheltered accounts has been confirmed by The Department of Labor.
The biggest changes we will see are in retirement accounts within full service brokerage accounts. We should not be trading in these expensive accounts but anyone who is will see major changes and may even get “bumped” out of their brokerages. If accounts remain in full service accounts they will probably end up fee based rather than commission based with all kinds of paper-work prior to the April changeover. Once again, most of us are trading with online discount brokers and all my research shows no meaningful changes.
Alan
Premium Members:
1- This week’s 8-page report of top-performing ETFs and analysis of ALL Select Sector Components has been uploaded to your premium site and is available in the “ETF Reports” section. Look for the report dated 11-2-2016.
2- For those coming to my workshop in Plainview, NY this Saturday, please bring a list of your current portfolio holdings as we will analyze these as a class:
http://www.meetup.com/LISTMG/events/233123688/
3- Our next Blue Hour webinar is on December 1st, free to premium members. The registration link will be available shortly. I have put up a course outline and webinar overview in the “resources/downloads” section of the premium site (right side…scroll down to “Blue Hour). This is especially useful for those not near retirement…bring children and grandchildren.
4- This weekend’s stock report will be published late Sunday afternoon/early evening.
For your convenience, here is the link to login to the premium site:
https://www.thebluecollarinvestor.com/member/login.php
Alan and the BCI team
If you anticipate upward movement in a stock, are you better off buying a call or selling a put?
Thomas,
I would favor buying a call. When selling puts, our maximum profit is the put premium itself with the caveat that position management techniques can increase the returns (like the 20/10% guidelines for put-selling). Such opportunities exist for covered call writing as well. When share price appreciates, put value declines and expires worthless if we take no additional action. On the other hand, call value moves up by its Delta and final profit is unlimited.
For the same reasoning, I would favor covered call writing and out-of-the-money calls to selling cash-secured puts in a bull environment where both call premium + share appreciation to the strike can be realized as opposed to put premium only. In the latter instance, we can tweak put premium higher by favoring near-the-money strikes rather than out-of-the-money strikes but still more and better opportunities for higher profits exists with covered call writing.
Alan