Options trading basics teaches us that the VIX or CBOE Volatility Index reflects the market’s expectation of the upcoming 30-day volatility. It measures market risk and is also known as the investor fear gauge. With this in mind, option-sellers are faced with a dilemma. Increased market volatility will translate into higher option premiums because the time value component of the premium is directly related to implied volatility. On the other hand, a high overall market volatility increases our risk as share value can plummet and erase our initial gains. The VIX mirrors degree of anticipated price movement but gives no information on direction. So, is a higher VIX a positive or a negative?
How can we learn from the crash of 2008?
One question that is frequently posed to me is that if the VIX is low do we stop selling calls because of lower premiums? This implies that a high VIX is a positive for covered call writers. Let’s take a look at an extreme example in 2008 when the VIX went from the 20 – 30 level to the 70 – 80 level in the last 4 months of the year:
VIX in 2008

As a general rule, the VIX and the performance of the overall market (S&P 500) are inversely related as demonstrated in the chart below where the market took a dive in the last 4 months of that year:

VIX and covered call writing
Covered call writing is a conservative strategy and those who use it are generally conservative investors looking to generate cash flow with capital preservation in mind. As such, a high VIX is no friend of option-sellers although we can use our common-sense principles to manage those scenarios. A low VIX (under 20) is usually a positive for us because it means a more stable market and oftentimes a rising market as we experienced since early 2009.
How to manage a high VIX
We can “stay in the game” by selling in-the-money call strikes and deeper out-of-the-money put strikes, using options with lower implied volatility (set goals at 1 – 3% instead of 2 – 4% as an example).
How to manage a low VIX
This is one of the factors that will give us the confidence to take a more bullish stance and sell at-the-money and out-of-the-money call strikes and closer to at-the-money put strikes as well as higher implied volatility options.
Real-life example with Boyd Gaming Corporation (NYSE: BYD)
The yellow rows in the option-chain below reflects appropriate choices with a high VIX (bearish) and the brown rows highlight appropriate choices when the VIX is low:
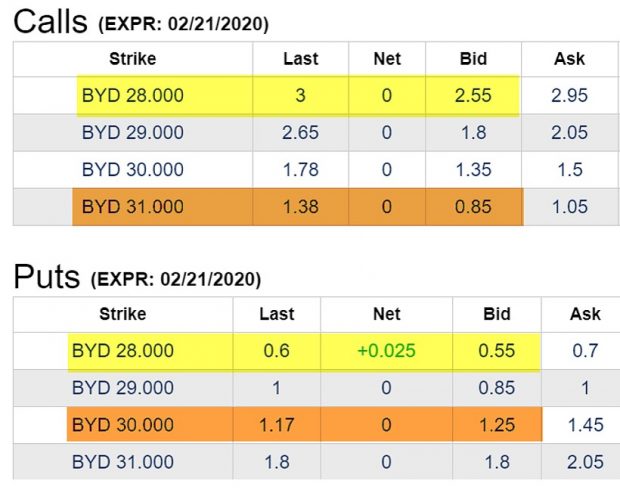
The exit strategies selected in these environments are detailed in my books and DVD Programs.
Discussion
The VIX is a factor that should be considered in our option-selling decisions. It should neither be feared nor embraced but rather managed using the fundamental, technical and common-sense principles of the BCI methodology.
Upgrades to our premium member ETF reports
Starting this week, The BCI team has added additional information and changed the format of our weekly premium member ETF Reports, thereby enhancing the quality of these reports and making them more user-friendly and time-efficient. Here is a link to a video overview of these new upgrades:
New ETF Spreadsheet
Your generous testimonials
Over the years, the BCI community has been incredibly gracious by sending our BCI team email testimonials sharing stories as to what our educational content has meant to their families. Moving forward, we have decided to share some of these testimonials in our blog articles. We will never use a last name unless given permission:
Hi Alan,
I recently discovered your content and am finding it incredibly useful.
Keep up the great work.
Kai (Hong Kong)
Upcoming event
Sacramento Options Traders webinar
Covered Call Writing with 4 Practical Applications
Sunday July 19th
12:30 – 4 PM
Login information to be sent to registered members (club and premium members)

***********************************************************************************************************************
Market tone data is now located on page 1 of our premium member stock reports and page 8 of our mid-week ETF reports.
********************************************************************************************************************


Hi Alan,
I have a question about reverse split and I’ll appreciate if you can answer this.
I bought 100 share of ODP for $2.52 and sold $2.50 call option @ $0.25 with expiry of 17 Jul 2020
Today I received the following message from my broker (Interactive Broker):
ODP@NASDAQ (Name: OFFICE DEPOT INC) announced a reverse split effective 20200630. The terms of the split are 1 : 10
I understand what is the reversal split but I don’t know what will happened to my call option and what is the best approach in this situation?
Thanks,
Amir
Amir,
A reverse stock split is a cosmetic attempt make a company appear financially stronger. It may also represent a deterrent to delisting from an exchange. On the split date, the number of shares of ODP owned will decrease by a factor of 10 and share value will multiply by a value of 10. 100 shares owned at $2.52 becomes 10 shares owned at $25.20. No change in actual value but a cosmetic alteration.
From the option contract perspective, the strike prices will be multiplied by 10, the ticker symbols will be changed reflecting the split and the # of shares delivered will change from 100 to 10. Option premiums will reflect time-to-expiration and stock implied volatility.
In this case, if exercised, you will be required to sell 10 shares at $25.00.
Here is a link to an article I previously published on this topic:
https://www.thebluecollarinvestor.com/reverse-stock-splits-understanding-contract-adjustments/
Alan
Hi Alan,
Thanks for your replay, as always all of your explanation/article/video are useful.
But if my 100 share converts to 10 what will happened, as minimum number of share should be 100? Will they cash me out? If yes, then do I have to deliver 10(100) share on my Call option if exercised? And if not exercised what can I do with 10 share?
By the way if I want to join to your premium, what is the minimum account balance I should have to be able to use your stock list? What is price range of your stock list in your report?
Thanks again,
Amir
Amir,
Your position value will be precisely the same post-split as it was prior to the split. No worries there.
Now, if the adjusted contract is exercised, you will be required to deliver 10 shares at the new strike of $25.00. If unexercised, you will own 10 shares at the (now) higher market price. If you want to sell a covered call at the higher strike, an additional 90 shares must be purchased. If that doesn’t work, you can sell the 10 shares and move on to a different security.
The takeaway is that a contract adjustment makes buyers and sellers of calls and puts “whole” Nobody wins and nobody loses as a result of the reverse split.
To use covered calls and be properly diversified, a minimum of $35k to $50k is needed for stocks and $10k to $25k for ETFs.
Our stock report that was published late last night has securities running from $5 to $443.
Most are in the $60 to $90 price range.
The learning process can start immediately.
Alan
Hi Alan,
great article, and very timely.
I have just returned to trading CC and CSP after a long period of “COVID vacations”.
Today I am 100% invested in the 07/17 options cycle, but watching my positions very closely.
The premiums are really very high, as you explain in this post, and I am aware of the increased risk, but with careful administration of the BCI exit strategies, I feel safe enough to keep my losses low.
Roni
Roni,
I know how diligent you are. By entering our BTC limit orders after entering a covered call trade, we have an initial critical layer of protection.
This is a fragile market with many companies refusing to offer guidance. If they don’t know, how are we to know?
My hope is that our members are trading within the framework that aligns with our personal risk-tolerance. No right or wrong here… personal preference.
Alan
Alan,
thank you for your kind and appreciated warning.
I will heed your comment, and make sure my potential losses are properly kept to a minimum by placing the BTC orders following the 20/10 guideline.
Your help is so valuable to me.
Roni
Hey Roni,
It’s great to have you back in the trading game with us! I am glad you chose the 7/17 expirations because I, like Alan and you, prefer the monthlies for csp’s and cc’s. I find they give me more wiggle room while remaining in the highest period of time decay.
That is not to say I don’t use the weeklies. Gosh, for other types of trades where I have a very short fused target in mind I use them every week!
There is nothing funny about COVID or our current market influenced by it. But since it is different and may not exactly be the scenario envisioned when exit strategy guidelines were crafted based on price movement history I am giving mine more leeway this month.
The only reason I suggest that for anyone’s consideration is the heightened volatility. The larger than normal % daily moves create the increased potential to get whip sawed out of a position only to see the computer algorithm’s whip back up the next day or week to squeeze the shorts and further frustrate what was probably a decent trade to begin with?
If all boats are getting washed out by the same tide and there is nothing wrong with my boat other than the tide I know the usefulness of moving to another just to catch the next up tide is not worth the bother….
A successful new week to all. – Jay
Thank you, Jay, for the warm Wellcome.
As you know, I am always trading monthlies only.
My work at my company was interfering with my trading, and therefore I was doing exclusively CCs, but now that I’ve sold the company, I have included CSPs, following your advice last week.
I am still very busy with the home chores aggravated by the COVID scare, which has us totally isolated at home in our apartment for the last 100 days and leaves me less time for trading.
Roni
Roni, despite these unfortunate times it is always a pleasure to read your posts and chat with you.
I think you will find csp’s a worthwhile add to your toolbox. I use them when something I like gets taken down not by fundamentals but purely market drift. I then sell a csp further under it to potentially get it at an even better price along with a nice return on the cash regardless of assignment.
I suggest not chasing premium because puts can get tempting on down days with a rising VIX. Instead focus on a couple stocks or ETF’s you would like to own at the lower price of your choosing. – Jay
Hi Jay,
I do also enjoy talking to you, and plus, I get the advantage of your excellent suggestions.
Please explain to me what you mean by ” not chasing premium” with CSPs.
I placed 17/07 CSP trades for stocks I would like to own and tried to go as deep OTM as possible while still getting a decent premium (3-4%) in this volatile moment. BA, MSFT, LLY, ULTA, and SSYS.
Roni
Hey Roni,
When I suggested don’t chase premium on csp’s I meant don’t pick things just based on premium. You have to decide on the stock or ETF first then find a premium and time frame that works for you.
You have already internalized this concept because the tickers you mention are investment grade. I was not talking about stocks like that or those that would appear on a BCI list. I was talking about those that may have eye popping premium appeal but there is a reason for that and it is rarely good :)!. – Jay
OK Jay,
now I understand.
Thank you – Roni
Premium Members,
This week’s Weekly Stock Screen And Watch List has been uploaded to The Blue Collar Investor Premium Member site and is available for download in the “Reports” section. Look for the report dated 06/26/20.
Also, be sure to check out the latest BCI Training Videos and “Ask Alan” segments. You can view them at The Blue Collar YouTube Channel. For your convenience, the link to the BCI YouTube Channel is:
http://www.youtube.com/user/BlueCollarInvestor
Starting this week, The BCI team has added additional information and changed the format of our weekly ETF Reports, thereby enhancing the quality of these reports and making them more user-friendly and time-efficient. Here is a link to a video overview of these new upgrades:
https://youtu.be/-wgqoyjP5bQ
Best,
Barry and The Blue Collar Investor Team
barry@thebluecollarinvestor.com
Hi Alan,
Thanks for your usual timely, concise, and practical discussion.
Of course, your excellent exit strategies are extremely helpful during times like this. (Any reader who has not yet done so should immediately purchase your comprehensive and easily understood book on exit strategies, as well as both editions of your covered call writing encyclopedia.)
I was wondering what you think about favoring weekly options during periods of high volatility in order to better manage risk.
Thank you for all you do for us Blue Collar Investors.
I hope that everyone on the BCI team, as well as all of your readers, exercises appropriate caution and stays safe during these difficult times.
Best wishes,
Ron
Ron,
Well stated. The health and safety of our BCI community is our highest priority. While we’re staying safe, why not make some money too!
I am a firm believer that we can beat the market on a consistent basis with Weeklys and Monthlys. My preference is for Monthlys where we have additional time for position management. I like Weeklys to circumnavigate around earnings and ex-dividend dates.
Each investor should decide on a strategy approach regarding the length of contract obligations and adhere to that whether they are Weeklys or Monthlys.
Alan
Hello BCI staff:
Question: In terms of covered calls, do EFT’s have overall better performance than individual stocks?
Thank You,
Georgia
Georgia,
ETFs represent baskets of stock, some moving up and some moving down in price. As a security, they are generally less volatile than individual stocks. There are exceptions.
Since the implied volatility is lower for ETFs, the option premiums will be lower but so is the risk we are exposed to.
Alan
Hello Alan and Company!
I was an original charter member many years ago. and now I am BACK! I never forgot about the successes I had with the BCI system.
Is there a negative drawback to writing longer-term deep-in-the-money covered calls? I am not sure what I am missing. I own many shares of WEN from over thirty years of DRIP investing from which I would like to derive income. Current share price is $21.06. If I write a 8/21/20 $18.00 strike call on them, the ROO is 10.4%. What am I missing about this trade that is a negative (besides losing the shares)?
Thank you in advance!
John
John,
Welcome back.
As of pre-market this morning, the bid price for the 8/21 $18.00 call is $3.60. The intrinsic-value component ($3.21) must be deducted to calculate our time-value profit which is 3% for 7-weeks, about 22% annualized.
The drawback is that we will be exposed to the 8/5 earnings report.
Alan
Alan,
I really like the changes in the ETF Report that you have made and it is definitely more user friendly.
You do an Excellent job.
Thank you for all that you do!
Pete T
Hi Alan,
I am new member. I would like to ask how much delta (STANDARD/NORMAL) should I enter a covered call trade for
In The Money (ITM)
Out The Money (OTM)
For example: AMD
Current price is 50.10
If I would like to sell ITM, which delta should I sell to minimize lost. (See the attached file for the AMD option chain)
If I would like to sell OTM, which delta should I sell to minimize lost. (See the attached file for the AMD option chain)
Thanks.
Vinh
CLICK ON IMAGE TO ENLARGE & USE THE BACK ARROW TO RETURN TO BLOG.
Vinh,
You are wise to evaluate strikes to mitigate overall market concerns. For covered call writing, using ITM strikes will afford the greatest downside protection due to the intrinsic-value component of our premiums. This means Deltas between 0.50 and 1.0.
Structuring our trades is based on our strategy goals and Delta is the result of these goals that the motivation behind them. Let’s say our initial time-value return goal range is 2% – 3% per month… in this case 19 calendar days.
Rather than focusing in on Delta, let’s look at strikes that achieve our initial time-value return range goal of 2% to 3% and meet our capital preservation requirement of writing ITM calls for additional downside protection. The “multiple tab” of the Ellman Calculator will be particularly useful in this regard.
Specifically, let’s look at the $46.00 and $47.00 ITM strikes in the option-chain you provided. The screenshot below of the Ellman Calculator shows time-value returns of 2.2% ($46.00 strike) and 2.8% ($47.00 strike). The downside protection of those time-value returns are 8.2% and 6.2% respectively. To achieve the best protection based on these parameters, the $46.00 strike would be an appropriate choice. Now, both have Deltas, of course. .75 and .70 but our decisions are based on strategy goals, not Deltas.
CLICK ON IMAGE TO ENLARGE & USE THE BACK ARROW TO RETURN TO BLOG.
Alan
Trading Experiences 6-29-20: Pandemic Recovery Chart:
I have created an interesting Pandemic Recovery Chart to illustrate the market performance of several investments as time progresses from around Feb. 20, 2020 when the market crash started, reaching a low point on March 23, 2020 and recovering from that time.
The chart I created also explains the results of some of the BCI Blue Chip Portfolio July 2020 selections.
Why I created this chart:
I am retired now but as a working electrical engineer I did not make the time to learn how to manage my 401K and IRA funds and I am sure there are millions out there in the same boat right now with the funds selected for their investment accounts. I also remember the 10 year period with a managed Fidelity account that I basically ended up not growing much. It turns out that my hard working hours is what contributed a lot to my retirement accumulation.
So with the valuable experience (over 4 years now) I have been getting with Alan learning about the market and trading options (books, videos, blog), market dynamics, selection, and management of investments, I decided around April of 2018 to help two of my children analyze their Retirement accounts.
I found that both of them had all their money invested in a couple of funds (look at BEGRX) with dismal performance and no growth apparent for their Franklin Templeton accounts (IRA and Non-Retirement). Another had a 401k and there was a managed Ameriprise account. I had my hands full.
At least I could recommend changes for their Franklin and 401k accounts. I also found beneficiaries issues, ownership issues, and the need for Living Trust / UTMA assignments as well since there were minors involved and other family situations. After checking the funds available for their year to year performance, yield etc, recommended changes were made to the accounts (diversified to 4 accounts, look at FKDNX, FKGRX).
Looking now 2 years plus later, the Franklin accounts performance through 6-19-20 (after the crash and recovery, the 2 year performance was: IRA – Up 36.7% (I deducted their recent IRA contributions), Non-Retirement account – Up 55.5%. The account values were also above and better that the values just before the crash.
The Ameriprise account value (Mutual funds (Large Cap, Mid Cap etc), ETFs, did not fare as well and was down 6.0% from the pre-crash account value. This got me thinking as why did this happen?
One obvious clue is the YTD performance of the funds. Since the start of the year was uniform, you can look at the YTD of a fund today to see the effects of the market crash. That explained a lot and correlates with the chart for the individual equities in the attached chart. There is a little casino effect in play here.
You will notice in the chart that Amazon (AMZN) and Microsoft (MSFT) market prices rise above the pre-crash values. These are the top 2 holding of Franklin FKDNX, which was one of my recommended funds.
On the other hand, the Johnson and Johnson (JNJ) and Berkshire Hathaway Class B (BRK/B) prices are well below the pre-crash values. These are the two 2 funds in one of the Ameriprise account Large-Cap Value Mutual Funds. I looked up a similar fund of Fidelity that Fidelity recommended as an equivalent to invest. Lo and behold the large cap Fidelity fund FLVEX also has the same JNJ and BRK/B funds as top holdings. I noticed other holdings were common in both funds.
The low performance of JNJ also explains why the BCI Blue Chip selections also changed. If you look back JNJ is in the Blue Chip Portfolio in prior months, but was removed from the July release.
Hope this was helpful to some readers. I would appreciate some comments if you can relate to some of the points I mention.
Regards,
Mario
Mario,
First, kudos to you for helping out your children and putting them on the road to financial intelligence as well as financial security. I have done the same for my children and grandchildren. It speaks well for the type of person you are.
I also, and have for sometime, admired your attention to detail and analysis. I have enjoyed your spreadsheets in the past as I am a spreadsheet guy, but not in your class.
Your analysis points out a very important point. For the last few years, for several reasons, the market has shifted. For decades small-cap, mid-cap and value as groups had been the long term best performers. That stopped a few years back. Large-cap, S&P 500, took over and never looked back. A diversified portfolio of all the groups has under preformed the S&P 500 now for several years.
More recently, a sub-group of the S&P 500, QQQ has done even better and another ETF, XLK has been right up there too.
A look at the top 10 holdings of QQQ and XLK is very interesting. MSFT and AAPL are one and two, respectively, in both. INTC, NVDA.CSCO and ADBE are in both top 10.
AMZN, FB, GOOG and GOOGL are in QQQ top 10 but not XLK. Instead XLK has V, MA, PYPL and CRM in it’s top 10.
I believe QQQ and XLK tell us not only where the market has been, but where it is going. Your charts are, in my opinion, confirm this view.
Keep up the good work. I know your children are appreciative.
Again, thanks for sharing.
Hoyt
Hoyt,
Thanks for your comments and the detail in your reply regarding QQQ and XLK. I am going to make it a point to look or glance at the Holdings of a Fund to see if something stands out that I should be aware of.
Interesting you note that a diversified portfolio of all the groups has under performed the S&P 500. Does that mean that current portfolios are not as diversified and is subject to more volatile swings with the market. Despite that vulnerability, the net performance is positive compared to a diversified set of groups.
Because of the recent swings we have seen, I am going to recommend the mutual funds go to 30% cash in the near future. That will corral some of the profits (for the IRA there no negative impacts), The cash can be used at a good opportune time when the market takes a downturn bearish reaction to an event. I can go back in any time after a few months if nothing develops.
Interesting how in the 2016 election many had the opinion the market would go down after election night and were holding cash for that event. It instead went positive.
Mario
Hey Mario and Hoyt,
Thanks for the fabulous discussion and thanks to Alan and Barry for making a forum like this available so we can have such chats!
One advantage I see in simply holding SPY as a core position and over writing it for maybe a 1% a month yield in an IRA is that assuming funds move between sectors within the S&P and don’t exit it for, say, TLT or GLD, the fund still benefits.
Now, if one is skilled at sector rotation than doing your own in and out of the XL components will yield gains! But I am not capable of that through my trial and error.. I just stay on the bus and don’t change seats every stop :).
I am heavy in XLK and XLV outside SPY and that has worked fine. I also hold and sometimes overwrite the Q’s. My premise is simple: the average 12 year old knows more about tech gadgets than I do and there are generations of us clogging the health care system. I don’t see either changing soon :)! Jay
Hey Guys,
Learning a lot here.
When I mentioned a diversified portfolio of other groups I was speaking specifically of Small-Cap, Small-Cap Value, Mid-Cap, Mid-Cap Value, Large-Cap Value, Emerging Markets, etc. Sub groups within the S&P(ETFs like QQQ and XLK) have outperformed the S&P 500. My bad for not being more clear.
Years ago I set up my grandchildren with a portfolio of nine of Vanguard’s Funds. Initially the group of nine out performed the S&P 500 by 1 to 1 1/2%. That stopped about five years ago and the group began underperforming the S&P 500. I understand from Vanguard that it was because most of the money that came into Vanguard was directed to S&P 500, which considered by many to be the market. Vanguard for several years got 1 out of every 4 investment dollars.
Keep up the good work guys.
Hoyt
Hoyt,
I understood you completely regarding the diversified portfolio.
I looked up (Investopedia.com) and refreshed my information on the Market Indexes and also learned about TMI (Total Market Index Funds). Included also Large Cap, Mid Cap, Small Cap Index funds, Regional, and Investment Class indexes..
Little by little all this information makes us a better informed investor. Meanwhile I am still looking for that Fountain of Youth (I did find a good video on the subject.).
Mario
Allen hi
i have a portfolio of dividend stocks that i intend to hold forever.
I’m trying to build a plan selling CC to manage this account.
for example i understand i will need the x dates or dividend dates to avoid writing calls that week.
i would like to write weekly if possible.
What else do you recommend to put in this plan?
i don’t mind if stock goes down, i’m holding it for the dividend.
Although I don’t want the shares to be assigned, some of them have high profit, and I don’t want to start paying taxes now.
thanks,
Avi
Avi,
Here is the best way to manage a covered call strategy with your specific stated goals:
1. Determine you annualized return goals from covered call writing, over-and-above share appreciation and dividend income
2. Write only out-of-the-money calls
3. Avoid selling options on the weeks of the ex-date and earnings date
Let’s say we are seeking to achieve an additional 10% annualized return from option premiums. We sell options that will return approximately 0.25% per week. Given that we are writing options 44 weeks out of the year, that will annualize to about 11%.
The BCI Portfolio Overwriting Calculator will be useful for these decisions.
Alan
Alan,
I am a new member and really enjoy learning from you. You make it so easy to understand.
One question I have is about rolling an option to the next month. Do we use the original purchase price of the stock or the current price when calculating our returns.
Thanks,
Tim
Tim,
Good question and thank you for your generous comments.
As expiration approaches, if we are considering rolling the option, the call strike is in-the-money. Our choices are:
1. Allow exercise and sale of our shares
2. Roll-out or out-and-up
If we allow exercise, our shares are sold at the original strike price. Let’s say we bought a stock for $58.00 and sold the $60.00 strike. As expiration approaches, share price is $62.00. If we take no action, our shares are sold at the $60.00 strike price. If we roll the option, our shares are worth $60.00 at that point in time and that is the price we use for our calculations (with the exception of tax calculations).
Therefore, the price we use for our calculations is neither the original price $58.00 nor the current price ($62.00) but rather the original strike price ($60.00).
Alan
Premium members,
A new ETF report is now available on your member site.
Upgrades to our premium member ETF reports:
Starting this week, the BCI team has added additional information and changed the format of our weekly ETF Reports, thereby enhancing the quality of these reports and making them more user-friendly and time-efficient. Here is a link to a video overview of these new upgrades:
https://youtu.be/-wgqoyjP5bQ
Alan, Barry and the BCI team
Alan,
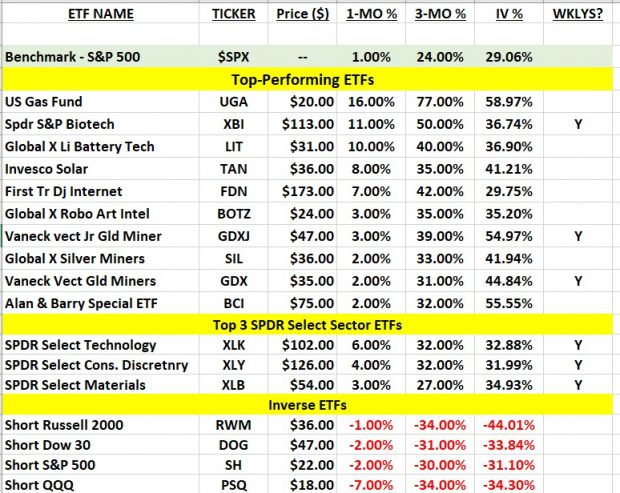
Thanks for the improved ETF Weekly Report. Concise with lots of useful information. Will provide a better picture of possible trading opportunities other than the top 6 in previous reports. I like the fact the IV% is included.
Other comments:
** I noticed that in the Inverse Exchange-Traded Funds Section that the comparison chart between the S&P 500 and the Inverse funds is missing. It is also missing in your video on the new changes.
I happened to pick this up while reviewing the new report because in this week’s blog Hoyt, Jay and I and I have been discussing S&P 500, indexes, and different classes of stock (Large Cap, Mid-Cap etc.) and I noticed in the report Russell 2000 Index (.RUT) and its inverse RWM was mentioned.
** XOP ETF was listed as in the top ETF list in the last 3 reports. The equity started going south the day the 6/23 report was released. I am a shareholder. Should it appear anywhere in the report with its current stats?
** Can you review / update, if necessary, the section on Current Implied Volatility at the end of the report. The IV volatility of SPX is repeated here and differs with the volatility listed in the main chart in the top of the report. The comment on average implied volatility for put and call options is also mentioned in the two sections as well.
Regards,
Mario
Mario,
Glad you like our new format and appreciate the comments and suggestions. My responses:
1.As you know, our previous format included more than the top-6, just not all in one place. Same for IV% that previously was located in the last 2 pages of the report and now located in the same spreadsheet and page of the new report. Now, all eligible securities and related info is in 1 place on 1 page, more user-friendly. I just printed out page 2 of the new report rather than 8 pages that I have been doing for years… less clutter on my desk!
2. The Inverse-ETF section is the last section of the report (last 4 rows). You may have to scroll down on your computer screen to see it. The information is no longer in graphic form in order to allow us to keep all info in 1 place and, as a matter of fact, allows us to add additional information (1-month returns) that previously was not included in the report.
3. RWM stats are located in the 3rd row from the bottom.
4. XOP is a great example of how the enhanced report can benefit us. Over the past 3-month time-frame, XOP is significantly out-performing the S&P 500. But, in the past 1-month time-frame, it is under-performing. The additional information allows us to focus in on those ETFs that have been out-performing in both time-frames. I believe that this upgrade will assist in bringing our returns to even higher levels.
5. The IV% for SPX is 26.10 as shown in the spreadsheet on page 2. Now, you make a great point that in the “explanation” section or “additional information” pages that explain each part of the report, we used a generic IV% that didn’t match the current IV%. I can see that being confusing so I will eliminate that IV% for the S&P 500 in the explanation section moving forward. All updated information will be located in the spreadsheet on page 2 of the report.
Thanks again for your valuable feedback.
Alan
Alan,
I agree with you that the Inverse chart and comparison to the S&P 500 is not needed and is superfluous. That is why I said review/update. If you are not using the chart, you have to change the sentences that refer to the chart in two places.
Here are the two sentences that need modification or deletion:
*****
The following inverse ETFs will be analyzed and compared to the S&P 500:
*****
Here is this week’s comparison chart with the S&P 500 with recent price and percent price change:
*****
Regarding XOP performance, I noticed XLE and XOP are tracking each other perfectly. I gather it is because of the Energy, Oil, Gas are related issues and are in the same sector. I see also that XLE is also completely out of the report as well.
*****
Mario
Thank you, Mario.
Alan,
Regarding the recent market crash in Feb-Mar.:
I do appreciate your release to the BCI members of the excellent detailed report you prepared and released about your market decisions, trades, and performance results as the market declined rather sharply. You took advantage of the inverse ETFs to write some covered calls. You followed the 10/20% guidelines to take advantage of a hitting the double underlying decline. You also may have rolled out an option.
You mentioned you remained 50% in cash while the market was declining.
** I wonder how you determined when the market was time the right time to invest you cash you were holding. Did you wait for a technical pattern in an index or specific equity chart? The fear is that you can prematurely invest your cash.
** When you decided to invest in the unused cash, since it could have been a sharp recovery surpassing any OTM strike you chose, did you stay long in some equities to maximize your gain or did you trade only covered calls which might cause you to buy back at a high intrinsic value above the strike and have an unrealized profit to deal with later.
Regards,
Mario
Mario,
I remain 50% in cash to this day. I do not have full confidence in this market despite the impressive recovery. Since 2008, this is the longest I’ve had a substantial amount of my stock portfolios in cash.
I base my market assessment on the charts of the S&P 500, the VIX and reading the weekly economic reports which we summarize in our weekend premium stock reports.
The Fed has infused trillions of dollars into the global financial markets which is a major factor in the stock market rise. We hope that acceleration is sustainable but the economic data may not support that. The jobs report was encouraging today but most expected those types of jobs to return. What about the rest? How many were lost permanently. How will this resurgence of the coronavirus cases in many states impact the economy? I don’t claim to know these answers since we are in unprecedented times. I do know that many corporations refused to give guidance during the past earnings season. If they don’t know, how are we to know?
My 50% cash position over the last few months is right for me but may or may not be correct for other investors. Even if I miss out on additional market appreciation, I will not second-guess myself because I know I am investing based on current market data and my personal risk-tolerance. I never tell others what to do but I’m happy to share what I’m doing and why.
Alan
Alan and Mario,
Alan, your explanation of your rationale for your cash position is right on. I feel exactly as you do. The jobs coming back now are the low hanging fruit and, while large in number in a historical context, pale in comparison to the number lost. Continuing claims are a disaster and many jobs are lost where the worker can’t file for unemployment benefits. While I am retired, my sons are not. The company for which they work is planning massive layoffs as soon as the PPP runs out. I am sure many more are. Also companies are figuring out how to do more with less and as soon as that is determined the employee count will go down.
I actually started my cash buildup last year only retaining Tech and Financials. I have moved out of most Financials. What was 60% cash in March is the same dollar value now but only 30% of my portfolio. I will add to that cash over the next month. I believe my cash as a percentage of my portfolio will go up on its on as the invested part declines in value due to the market.
Thanks for providing this venue. It has been very helpful to me.
Hoyt
Alan and BCI team,
I love the new ETF format. Thanks for finding ways to make life easier for retail investors. When looking at the chart on page 2 which column should we give more priority, 1 or 3-month returns?
Thanks again,
Marsha
Thanks Marsha.
Since all the eligible ETFs have out-performed the overall market in the past 3-months, giving recent term performance a solid foundation, I would use the 1-month returns to make final decisions.
Alan
Dear Alan;
I am a premium member. My current portfolio is the SPDR etfs. On June 19th I bought 400 shares of XLE@39.17 a share and STO 4 contracts of the July 17 42 strike for a premium of .755.
XLE closed today at 36.93 and the 42 strike is at .16 ( 20% value of original option premium) Using the BCI strategy should I be closing out the XLE anyways because of the 8-10% loss in share price?
I plan to close the XLE options and sell the XLE stock. Then buy 300 shares of XLB @$56.47 and sell the 56.50 July 17 strike for a premium of $1.29.
This will make up for most of the loss. Does this make sense?
Thank you.
Donna
Donna,
Great due-diligence in trade management.
I would definitely have closed the short calls at $0.16 because it met our 20% threshold. The next step is in question. As I type, XLE is trading at $37.68, about a 3.8% decline from when the trade was executed. “Hitting a Double” and rolling-down are strategies that are still in the game based on these statistics.
Keep up the good work.
Alan
Donna,
Alan is correct in that you should buy back the Call using the 20% BCI guideline threshold when a position declines in value. You can then wait for a possible price recovery in XLE and sell another option.
Other things you can consider in the last two weeks are roll down for additional premium and also a Stock repair Strategy if the price recovers sufficiently. You can use the Google search in the Blog to look up more information.
I also own 500 shares of XLE, but in a long position and at a price of 38.48. I hope the price does recover. Actually it did for a short while Thursday (high = 38.21) morning but I missed it for a chance to come out near break even. Ended down 2.96%.
I will respond more in next weeks blog with an analysis of the Gain and Gain% of your position at different stages of the trade including buy back. Gives me a chance to explain how I document my trades and how I calculate my trade Gain and Gain% at any time (after dividends, buy backs, rollout etc.) for all my trades easily.
Have a nice weekend.
Mario
Alan:
I am hoping that you can help me understand something that does not seem to make any sense to me. Usually, the price shown for options I have sold corresponds closely with the price shown on the option chain.
However, I sold some GLD call options (July 17 EXP., 131 strike), and the price showing from Fidelity is 30.3, but the price showing on the option chain is 36. What am I missing here?
Thanks,
Paul
Paul,
An option-chain will give several bits of information. The actual option value lies somewhere between the bid and ask prices. In this case, $36.00 is accurate.
Now, the chain will also give the price of the last trade executed, in this case $30.30.
So, the values you are looking at do make sense as reflected in the screenshot below.
CLICK ON IMAGE TO ENLARGE & USE THE BACK ARROW TO RETURN TO BLOG.
Alan
Thank you for the explanation. I have only noticed this once before, perhaps because the amounts involved in the difference are usually small.
Paul