Covered call writing involves a minimum of 2 legs: we are long the stock (own the stock) and short the option (sold the option). There are many times when we employ the position management skill and options are bought back and new options sold or our underlyings are sold. This adds additional legs to the trade and calculations can become challenging to compute and interpret. On June 4, 2018, Kaveh sent me a series of trades he executed that I thought would serve as a great example as to how to decipher the trade results.
Kaveh’s trades through the middle of the June 2018 contracts using Viper Energy Partners LP (NASDAQ: VNOM)
- 5/21/2018: Buy VNOM at $33.30
- 5/21/2018: Sell June $33.00 in-the-money call at $0.90
- 6/1/2018: Buy-to-close the June $33.00 call at $0.15
- 6/1/2018: VNOM trading at $30.41
- 6/1/2018: Sell-to-open the June $29.00 call at $1.75 (rolling down from the $33.00 call to the $29.00 call)
As of June 1, 2018, we have 4 legs to these trades:
- Buy stock
- Sell $33.00 option
- Buy back $33.00 call
- Sell $29.00 call
We also have the current share price significantly lower than when initially purchased. So where do we stand at this point in time and could we have improved our situation? The best way to simplify a situation like this one is to break up the stats into the “stock side” and the “option side”.
Stock side of these trades (commissions not factored in)
As of June 1, 2018, we have a loss of $2.89 per-share ($33.30 – $30.41)
Option side of trade (commissions not factored in)
As of June 1, 2018, we have a net credit of $2.50 per-share ($0.90 – $0.15 + $1.75)
But wait, what are our shares really worth on June 1st?
$29.00…as a result of selling the in-the-money $29.00 call. Therefore, our share loss is really $4.30 per-share.
Current status as of June 1st
We now have a net debit of $1.80 per-share ($4.30 – $2.50) + trading commissions. This represents a loss of 5.4% on a cost basis of $33.30 per-share.
Possible ways to have improved these results
When we close out short calls in the first half of a contract, we consider waiting to “hit a double” in expectations of share recovery or selling the underlying if that stock was significantly under-performing the S&P 500. In this case, share value declined by 8.7%, while the market benchmark moved slightly higher. Strict adherence to the BCI exit strategy guidelines would lead us to selling the stock and using the cash in a completely new position to mitigate the initial losses.
Chart confirmation

VNOM PRICE DECLINE IN LATE MAY 2018
This price chart confirms the dramatic price decline in late May 2018 after a superb run-up from August 2017 (yellow field). This was true for the entire energy sector.
Comparison chart with S&P 500
When we have price decline in our underlying, leading to exit strategy opportunities, we view stock performance relative to the overall market to guide us to decisions between rolling down or closing the entire position (short call and long stock). The screenshot below may guide us to closing the entire position in an effort to mitigate losses:
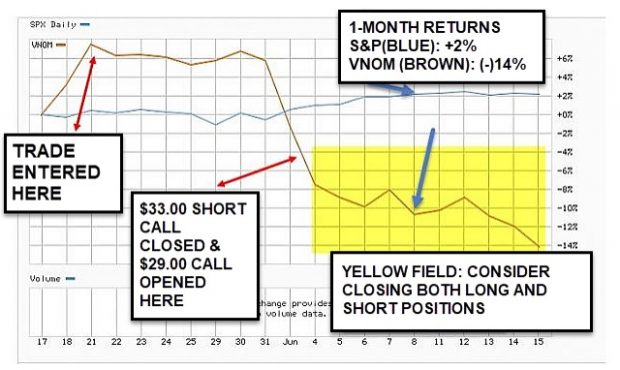
VNOM UNDERPERFORMING the S&P 500 DURING the JUNE 2018 CONTRACTS
Discussion
When using multi-leg trades when instituting exit strategies, a way to clarify calculations and positions is to break down the stock and option results separately. Following the BCI exit strategy guidelines will result in mitigating losses and enhancing gains.
**********************************************************************************************************************************************
HOLIDAY DISCOUNT CODE
Give the gift of education this holiday season and use this discount promo code to get a 10% discount at checkout on all items in the BCI store:
HOLIDAY10
Click here to enter the store the BCI store
**********************************************************************************************************************************************
Upcoming event
February 7th – 10th, 2019
Orlando Money Show
Omni Orlando Resort @ Champions Gate
February 7th – 10th 2019
Speaking schedule:
1. Getting Started with Stock Options: Creating Monthly Cash Flow with Covered Call Writing
February 8, 2019, 3:10 pm – 3:40 pm
2. Getting Started with Stock Options: How to Select the Best Options in Bull and Bear markets
February 9, 2019, 2:00 pm – 2:45 pm
Market tone
This week’s economic news of importance:
- Home builders’ index Nov. 60 (68 last)
- Housing starts Oct. 1.23 million (1.232 million expected)
- Building permits Oct. 1.26 million (1.27 million last)
- Weekly jobless claims 11/17 224,000 (215,000 expected)
- Durable goods orders Oct. -4.4% (-3.4% expected)
- Existing home sales Oct. 5.22 million (5.18 million expected)
- Consumer sentiment Nov. 97.5 (98.3 expected)
- Leading economic indicators Oct. 0.1% (0.6% last)
THE WEEK AHEAD
Mon Nov. 26th
- Chicago Fed national activity index Oct.
Tue Nov. 27th
- Case-Shiller house prices Sept.
- Consumer confidence index Nov.
Wed Nov. 28th
- GDP Q3
- New home sales Oct.
Thu November 29th
- Weekly jobless claims 11/24
- Personal income Oct.
- Consumer spending Oct.
- Pending home sales Oct.
Fri November 30th
- Chicago PMI Nov.
For the week, the S&P 500 moved down by 3.79%% for a year-to-date return of (-)1.54%
Summary
IBD: Market in correction
GMI: 1/6- Bearish signal since market close of November 11th, 2018
BCI: Selling only in-the-money strikes. The fundamentals are still in place for a market turnaround. The December Fed announcement will play a major role in end-of-year price movement.
WHAT THE BROAD MARKET INDICATORS (S&P 500 AND VIX) ARE TELLING US
The 6-month charts point to a bearish tone. In the past six months, the S&P 500 was down 4% while the VIX (21.52) moved up by 71%.
Wishing you much success,
Alan and the BCI team
The situations described in this article are the hardest to manage… I usually buy stocks that have favorable long term prospects and that I’m comfortable owning long term with the premise they will rise with time. If VNOM was such stock I’d probably ‘hold the strike’ (keep selling 1 month $33 CC for lower premium waiting for rebound) instead taking a loss. But I don’t know if this is a proper strategy long term. After the recent sell off I’m in a very similar situation with QQQ. I bought at $173.87 on 10/22, sold 11/23 $175 CC for $4.22 lowering my breakeven to $169.65. As of 11/23 QQQ closed at $159.21 and my call expired worthless. I think ‘holding the strike’ might be the appropriate strategy here, so I will probably wait for 1-2 weeks expecting QQQ to rebound to $165 area and will sell a new monthly CC for $174-175 then. Or is it better to sell ITM strike to mitigate losses and have more protection if QQQ will continue to decline?
Any suggestions?
Sunny,
We favor OTM strikes when we have a bullish outlook on the underlying and ITM when there is a bearish or volatile outlook. Now, there has been a dramatic and unexpected breakdown in the overall market and tech in particular. It is important not to panic…this has happened before and will happen again at some point. There is a lot of quality in QQQ so the use of OTM strikes is not unreasonable despite the technical breakdown. Again, this depends on our overall market assessment.
Waiting 1 – 2 weeks will cause a dramatic decline in time value premium for the December contracts. The original cost of the shares should play no role in our decision today. That was then, this is now. We decide on OTM or ITM and then determine our initial time-value return goal, say 2 – 3% at this point in the contract. That may lead us to OTM strikes between $161 – $163 or ITM strikes $155 – $157. Adjustments can be made based on initial time value return goals.
Alan
Alan,
I made some calculations on ETF’s using historical options data and got better long term results with ‘holding the strike’ strategy than selling ATM calls soon after the substantial index declines. This is why I’m confused.
‘Holding the strike’ only works for indexes and stocks with long term upward bias, but I’m confident in QQQ and tech overall and see this decline as temporary. The question here is what is better, to chase a premium and miss the possible rebound or just stay on the sidelines for some time waiting for rebound and better entry point for new CC.
As I understand BCI methodology would favor keep selling CC doesn’t paying much attention to the original cost of shares.
Sunny
Sunny,
I’m happy to clarify:
Given the following:
1. We have defined our strategy for a portfolio as covered call writing (or put-selling) for the purpose of generating cash flow.
2. We will undertake either Weekly or Monthly obligations (the latter my preference but both work).
3. Our portfolio consists of stocks that are currently priced either higher or lower than the original purchase price.
The BCI methodology guides us as follows:
1. We must be acutely aware of Theta (time value erosion) and sell our options at an appropriate time, early in the Weekly or Monthly contracts.
2. If bullish on the underlying (from current price point), we favor OTM strikes to both generate premium as well as allow for share appreciation.
3. If we are bearish on market outlook but still feel the stock has a favorable short-term outlook, we favor ITM strikes to both generate time-value premium and receive the additional downside protection offered by the intrinsic value of the premium.
4. At all times, we are prepared to execute exit strategy trades if and when those opportunities arise. This will allow us to mitigate when trades turn against us and generate even higher returns when trades turn out better-than-anticipated.
5. Once we have made a decision to retain a stock in our option-selling portfolio, the original purchase price, whether higher or lower, plays no role in strike selection, timing of trades or position management execution.
Finally, let me address a scenario where we are bullish on QQQ, assuming the security was purchased at a higher price point in an option-selling portfolio. We can continue our objective of generating cash flow and, at the same time, allow for share appreciation by selling out-of-the-money (OTM) strikes. If we are strongly bullish, we favor deeper out-of-the-money strikes that meet the lower end of our initial time value return goals. For example, if our Monthly initial time value return goals are 2% – 4%, we will favor deeper OTM strikes that meet the 2% end of the range.
Every strategy has its advantages and disadvantages. In my view, covered call writing advantages far outweigh the disadvantages, capping the upside being the main one. That negative will never “go away” but we can manage it via smart strike price selection and position management techniques.
Alan
Alan,
Thanks for clarification. This is very helpful.
And referring to Jay’s comment, my intention to buy QQQ this time was for cash flow generation selling CC, not long term holding.
Sunny
I use thinkorswim a lot – 11/30 163 call has about a 25% chance of being in the money – about $.85 premium – keep selling weekly calls and hopefully keep rolling up…keep track of the price as you may have to roll sooner if the price bounces up – if you think of QQQ as a long term hold then the premium you get is like a dividend of about 25%…and you don’t have to worry about the earnings report
Hey Sunny,
QQQ is a core holding for me. I have been over writing it every month NTM for a while now since it’s top stocks were over extended. I have always done better in the options selling game by thinking about the under lying more than the premium. When I am bullish QQQ I only cover half of it, for instance. I am bearish of late so I over write it all. I won’t always get it right but it gives me a frame of reference.
In my opinion a lot of covered call writers, at least when starting out, (and I am certainly not accusing you of this) get seduced by
premium and forget all about the under lying. That is a huge mistake because the risk is never in the option we sell it is in what we sell it against.
QQQ has been and will be a good one for our strategies going forward. I sold an OTM CSP on it for Dec expiry on the Tuesday sell off since it would not break my heart to own more of it.
I can only speak for me but I find it helpful to first define my relationship with the under lying equity. Am I in this for the premium this month or is it an investment? Knowing that will help determine how I manage the options selling.- Jay
Hi Jay,
huge risk in the market. I’m 100% in cash after big losses. Waiting for calmer waters.
Roni
Hey Roni,
I don’t blame you. These days a beach blanket seems a much better place to be than out in the water :). If we get a bounce day buying a small position in SH which is the unleveraged short of the S&P would not be the end of the world. – Jay
Jay,
the bounce is here, but the FED will probably spoil the party this week.
Roni
Premium Members,
This week’s Weekly Stock Screen And Watch List has been uploaded to The Blue Collar Investor Premium Member site and is available for download in the “Reports” section. Look for the report dated 11/23/18.
Also, be sure to check out the latest BCI Training Videos and “Ask Alan” segments. You can view them at The Blue Collar YouTube Channel. For your convenience, the link to the BCI YouTube Channel is:
http://www.youtube.com/user/BlueCollarInvestor
Since we are in Earnings Season, be sure to read Alan’s article, “Constructing Your Covered Call Portfolio During Earnings Season”. You can access it at:
https://www.thebluecollarinvestor.com/constructing-your-covered-call-portfolio-during-earnings-season/
Best,
Barry and The BCI Team
barry@thebluecollarinvestor.com
Goldman Predicts Commodities Will Soar in 2019:
The bank recommends selling an $50 a barrel December 2019 WTI put option, which is currently worth $7.25 a barrel as of Friday.
Guys, what do you think?
Hey Andrey,
Commodities are tough because of the politics. I have a small amount of USO, GLD and SLV. Crude is a football because of various tariffs and sanctions. It’s a coin toss and your guess is as good as mine. Selling a long dated OTM put seems reasonable since time decay is always on our side. I am not sure how WTI settles, I have never traded it but thinking risk first I would be certain I understand what happens if the trade does not work. – Jay
Hi Alan and BCI members
I have a question about Protective put and would really appreciate if you can confirm my understanding.
If I understood properly, the value of a Protective PUT (BTO OTM PUT) will increase if the value of the stock decrease, so that if i want to keep the stock (even if it depreciated) could be a good idea to STC the PUT that now is ITM, to compensate the stock value decrease.
Is it right? could it be a viable strategy to stand ER of a stock you want to keep? (due to rially low purchase price)
thanks a lot
Federico
Hey Federico,
It is important you talk with your broker and understand how they settle ITM bought options that you let expire. I have found it is better to take profit on them and STC as you suggest before hand.
I also think you should treat a bought option as a separate trade from owning the stock. The stock can recover if it goes against you. The bought option can’t. – Jay
Premium members:
This week’s 8-page report of top-performing ETFs and analysis of ALL Select Sector Components has been uploaded to your premium site. The report also lists Top-performing ETFs with Weekly options as well as the implied volatility of all eligible candidates.
New members check out the video user guide located above the recent reports.
For your convenience, here is the link to login to the premium site:
https://www.thebluecollarinvestor.com/member/login.php
NOT A PREMIUM MEMBER? Check out this link:
https://www.thebluecollarinvestor.com/membership.shtml
Alan and the BCI team
Hello Alan,
I am a premium member (just joined this month) and very new to covered call writing and still consider myself in “Covered Call 101” class. So, I have a question regarding a series of covered calls that I placed on a security, ticker symbol BEAT, that was in premium watch list.
I initially purchased this security at $62.25 on November 12 and sold a covered call with $60 strike price set to expire on December 21, 2018 for premium of $5/share. Now, today, BEAT had a break out day (closing price today is $69.29) and so I bought the shares back at $9.50/share when share prices were hovering around $68.85 and sold another covered call with strike price of $70 for $2.50/share, which will expire on December 21st.
1. Is mentioned scenario above categorized as “hitting the double”?
2. I calculated the return to be around 7%? Is that correct or am I calculating it wrong?
Please let me know if I am on a right track of understanding the covered call writing process, (especially, exit strategy) based on the scenario above or I am on the wrong side of this.
Thanks,
Nirav
Nirav,
This is a series of trades that has so far worked out quite well so congratulations for that. Now, all trades represent learning experiences so let’s see what we can glean from your trades:
1. The initial time value return on the $60.00 option was 4.58% with 3.6% downside protection of that time value profit…nice.
2. The short call was closed at $9.50 with share price $8.85 above the original strike, making the time value cost-to-close $0.65 or 1.1% of the current value of the stock ($60.00 because of the contract obligation).
3. Of the 4.58% originally generated, 1.1% was “given back” when closing the short call. Now, the question is “can we generate more than 1.1% by 12/21 to make this maneuver beneficial?” Since we are far from 12/21, the answer is most-likely yes.
4. The $70.00 call was sold for an initial time value return of 3.6% ($2.50/$68.85), so we did generate much more than the 1.1% cost-to-close.
5. The strategy employed here is closer to the “mid-contract unwind” exit strategy. This is when share value rises well past the strike, leaving the strike DEEP in-the-money and the time value component of the option premium approaching “0” We use it early in the contract and when the opportunity exists to generate at least 1% more than the time value cost-to-close. Generally, this strategy is employed with a different underlying after the initial trade is closed (both legs, option and stock) to avoid a bounce back from profit-taking after the significant run-up in price. The steps you took is called “rolling-up” in the same contract month.
6. “Hitting a Double” is when share value declines causing the short call premium to decline and meeting our “20%/10%” guidelines. Then we wait for a share recovery and re-selling the same original option in the same contract month. I generally prefer an in-the-money strike for this second trade (second income stream) unless we are in an extremely bullish market environment.
Please check the exit strategy chapters in both versions of “The Complete Encyclopedia” for detailed examples with explanations of these critical exit strategies.
Good job!
Alan
Hi Jay thanks for your answer.
My situation is the following, I have very low cost shares of EW and i m thinking to protect those shares with a protective put around next ER.
To check if i uderstood properly can you confirm that a Protective PUT (BTO OTM PUT) will increase if the value of the stock decrease, so that if i want to keep the stock (even if it depreciated) could be a good idea to STC the PUT that now is ITM and keep the stock? The increase in value of the put will compensate the decrease in value of the stock that I will keep.
On the other hand if the stock value increse after the ER the value of the protective put should decrease in this case it could be sold for residual value or let expire.
One more question i have is what should be a proper time frame for a protective put? I mean if the ER is on the 7th of Feb is it correct to write the put starting from the week before and ending the following week?
thanks for your help
Hi Federico,
Thank you for the follow up and for asking my opinion. If you buy a put to protect EW it will appreciate in price if your stock goes down. I would look at buying something about a .5 Delta so as to strike a balance between cost and potential gain on the put. Some like buying protective puts right at the money or current stock price but you pay more for that.
And there is not an outcome I am aware of where your broker would take your shares if you buy a protective put. If the put expires ITM you could have an obligation for more shares, that is why I suggested you be aware of how ITM bought puts are settled and probably just sell it first if the put is worth more than you paid for it after the earnings report comes out.
To make sure we are using compatible terms you mention writing the put starting the week before and ending the following week.I think what you are trying to do is protect your EW shares during it’s earnings report on Thursday, Feb 7? If so you could buy 1 put contract for every 100 shares you own as late as the day before, on Feb 6th for the Friday Feb 8th expiration.That way you would not be buying much time value but the price will still be higher than normal for your “insurance policy” since the implied volatility and therefore the prices of options go up around earnings reports and then fall thereafter.
If you want to “buy more insurance” you could buy the put that expires with regular monthlies on Feb 15 in case you want to give any post earnings effect on EW some extra time to sort itself out. As the date gets closer we can look at where the share price is and how it has been performing and discuss a specific strike price for the put you buy. But you have likely had the shares long enough you know what the track record is.
And, yes, if EW should go up on earnings your bought puts will go down in value fast and, like other insurance you have, it just won’t be anything you use this time! And hopefully the gain in the stock is more than what you paid for the protection. – Jay
HI Jay
I very much appreciated you help and support.
Now is a lot more clear for me and i feel more confident.
When the ER will approch i will try (may be with your help) to figure out a proper time and strike for the protective put
Thanks
Federico
Hi I m interested in High dividend Yeld stock and covered call writing. After reading the articols and the High dividend yeld stock list in Premium members i would appreciate if you can clarify some points:
-is there any legenda for this list?
– what is 6- MO RS and Ind Group RS?
– what could be a proper criteria to select one of the stocks in the list?
I understand that this is not the main strategy of BCI but i m interested in using it for a part of my portfolio, so i would like to ask if there is any BCI member that is using it and how is the strategy doing.
For instance i could be interested in the following trade, please advice me if i m missing something:
BUY 100 T stock at 30.75
STO ITM C JAN17 2020 (415 days) for a premium of: 10.75
Cost basis reduction= 30.75 – 10.75 = 20.00
T dividend is 2$ and 6.51%Yeld on a cost basisi of 30.75$
But now my cost basis is 20.00 so the ROO is 2:20.00 = 10%
what do you think? Is it a proper implementation of the strategy or not?
thanks a lot for your constant support
Federico
Federico,
Your example is a good one. I know we have members that use the strategy but traditional covered call writing and put-selling represent the main strategies used by BCI members. There is also a growing percentage of members using the strategies found in our latest book, Covered Call Writing Alternative Strategies”
Here are the definitions:
6-month RS (relative strength):
Measures each stock’s price performance over a 6-month period, compared to all other stocks. Emphasis is given to more recent pricing. Relative Strength Ratings value ranges from 1 to 99 (highest). A relative strength rating of 90 indicates the stock has outperformed 90% of all other stocks.
Group RS:
A measurement of a stock’s industry group performance over the past six months utilizing an A+ to E scale. All IBD 197 Industry Groups are compared and distributed into 13 rating groupings: 12 of near equal size and one comprised of industry groups with “E” ratings. An “A+” rating indicates the best performing group; an “E” rating indicates the poorest price performing group.
Alan