Technical analysis is one of the critical tools available to us in selecting the best stocks for our option-selling strategies. Price charts are much more than a sequence of dots and lines…they tell a story about a company which, with proper research, ultimately leads to a series of rules and guidelines that will assist in elevating our returns to the highest possible levels. This article will highlight a real-life example with AbbVie Inc. (NYSE: ABBV), a drug manufacturer and its price movement from January through May of 2018. My thanks to Vasanthi for sharing this trade with our BCI community.
ABBV price chart (the “story”)
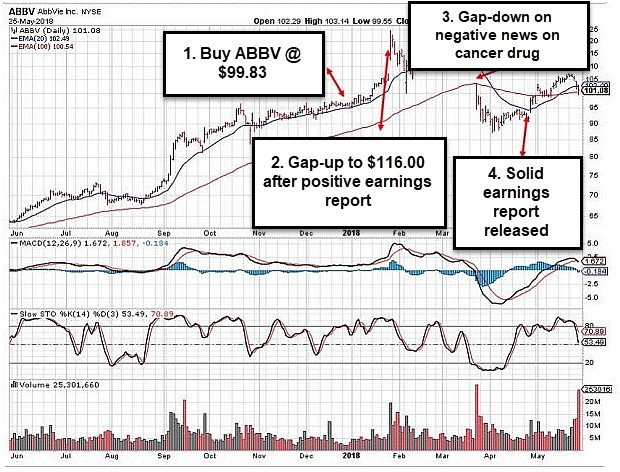
ABBV: 1-Year Price Chart
ABBV: 1-Year Price Chart
- In mid-January, ABBV was purchased for $99.83 (strong technical indicators)
- In late-January, a positive earnings release resulted in a gap-up in price
- Negative news in late-March regarding one of its cancer drugs resulted in a gap-down in price
- A strong earnings report resulted in an ensuing price acceleration
Strategy guidelines resulting from “the story”
- Bullish technical indicators are one of the screening requirements for short-term option-selling
- Earnings reports can result in extreme price fluctuations and therefore must be avoided. Covered call writing and selling cash-secured puts are conservative option-selling strategies where capital preservation is important to retail investors and we don’t want to convert these strategies to risky schemes
- Drug manufacturers are among the most volatile underlyings due to the constant news regarding various studies on its pharmaceutical products. We must be sure that we have the appropriate risk-tolerance to use such securities
- Mastering the position management skill is critical when exit strategy opportunities arise. Whether share price moves up or down dramatically, there are maneuvers we can execute that will mitigate losses and enhance gains
Discussion
Technical analysis is an essential tool that will enhance the quality of our stock selection process as well as tell a story regarding events impacting the price performance of a stock. This mosaic of “dots and lines” will lead us to rules and guidelines that will elevate our overall returns to the highest possible levels. Our 2 additional screens include fundamental and common-sense analysis.
Recent event
November 2018:
The Blue Hour Webinar # 12: When to Roll our Covered Call Options
***Premium site…premium members only
Now available on premium and video sites
February 7th – 10th, 2019
Orlando Money Show
Omni Orlando Resort @ Champions Gate
February 7th – 10th 2019
Speaking schedule:
1. Getting Started with Stock Options: Creating Monthly Cash Flow with Covered Call Writing
February 8, 2019, 3:10 pm – 3:40 pm
2. Getting Started with Stock Options: How to Select the Best Options in Bull and Bear markets
February 9, 2019, 2:00 pm – 2:45 pm
Market tone
This week’s economic news of importance:
- Markit services PMI Oct. 54.8 (54.7 last)
- ISM non-manufacturing index Oct. 60.3% (59.0% expected)
- Job openings Sept. 7.0 million (7.3 million last)
- Consumer credit Sept. $11 billion ($23 billion last)
- Weekly jobless claims 11/3 214,000 (210,000 expected)
- FOMC announcement 2 – 2.25% (as expected)
- Producer price index Oct. 0.6% (0.2% expected)
- Consumer sentiment Nov. 98.3 (98.2 expected)
- Wholesale inventories Sept. 0.4% (1.0% last)
THE WEEK AHEAD
Mon Nov. 12th
- None: Veteran’s Day
Tue Nov. 13th
- NFIB small-business index Oct.
- Federal budget Oct.
Wed Nov. 14th
- Consumer price index Oct.
- Core CPI Oct.
Thu November 15th
- Weekly jobless claims 11/10
- Retail sales Oct.
- Philly Fed Nov.
- Business inventories Sept.
Fri November 16th
- Industrial production Oct.
- Capacity utilization Oct.
For the week, the S&P 500 moved up by 2.13%% for a year-to-date return of 4.02%
Summary
IBD: Market in confirmed uptrend
GMI: 4/6- Bullish signal since market close of November 8th, 2018
BCI: Selling only in-the-money strikes until market recovery is confirmed. Remain confident in long-term health of the stock market. No change from last week.
WHAT THE BROAD MARKET INDICATORS (S&P 500 AND VIX) ARE TELLING US
The 6-month charts point to a bearish-to-neutral tone. In the past six months, the S&P 500 was up 3% while the VIX (17.41) moved up by 30%.
Wishing you much success,
Alan and the BCI team
Alan,
How do you handle events like this October selloff? I bought some stocks off of the list that were sound and appropriate for my risk level. They sold off below my purchase price. I still like the stocks and wondered how you write your way out of pull backs?
Since the premiums are lower on the out of the money strike prices (strikes above my original cost) how do you write your way out of this situation?
I love your system!
Mac
Dallas, Texas
Mac,
Thanks for your kind words.
Management of our positions in one of the 3-required skills including when share price declines. First, options are closed (bought back or buy-to-close) using our 20%/10% guidelines. Once that step is executed, we can wait to re-sell the same option (“hitting a double”), roll down (sell a lower strike price) or sell the stock depending on factors detailed in my books and DVDs.
Recently, we highlighted information on the “stock repair” strategy for those who are long stocks in a “stock only” portfolio and how to repair share losses:
https://www.thebluecollarinvestor.com/stock-repair-strategy-using-stock-options-to-reduce-losses-when-stock-price-declines/
I would encourage all option traders to focus in on the exit strategy sections of the BCI books and DVDs. Mastering that information will put cash in our pockets.
Alan
Alan, hello.
I’m in a pickle regarding a stock that I bought about a month ago 100 shares of ROKU. Of course I was not a member of BCI at the time so I did not implement an exit strategy.
Now this is the dilemma. I bought ROKU for the amount of $75.03 and a sold a Nov 9th covered call at a strike price of $60.00. Currently the stock is trading $43.94. I’m incurring in a $31.06 loss which is a lot of money.
Can you please advise in what should I do now?
Thank you.
Americo
Americo,
At this point, we have $4394.00 of cash invested in ROKU. The question we ask ourselves is “is this cash best placed in ROKU or in another security” The fact that we paid $7503.00 does not factor into this decision. It would be painful to sell at $43.94 and incur that huge loss but if ROKU declines to $25.00, we would have wished we sold at $43.94. On the other hand, we may make the assessment that ROKU is a great buy at this price and a stock we should keep.
I commend you for recognizing that exit strategy opportunities were missed but here we are today. Start by analyzing why the share loss. A good free resource is:
http://www.finviz.com
ROKU was initially taken down by the large tech decline in October and further exacerbated by a disappointing earnings report on 11/7.
If our assessment is to sell, we must take the painful action of realizing this loss and moving on. If we feel that the stock is a “buy” at this price, writing out-of-the-money calls (and avoiding earnings report as described in the BCI methodology) is the route to take.
Trades like this one hurt a lot but can be invaluable learning experiences and will, in the long run, make us better investors.
Alan
Alan, thank you. Very disappointed in my part that I did not know before of your program and expertise on the exit strategy; I’m sure I could have avoided my current situation.
Again thank you,
Regards, Américo
Premium Members,
This week’s Weekly Stock Screen And Watch List has been uploaded to The Blue Collar Investor Premium Member site and is available for download in the “Reports” section. Look for the report dated 11/09/18.
Also, be sure to check out the latest BCI Training Videos and “Ask Alan” segments. You can view them at The Blue Collar YouTube Channel. For your convenience, the link to the BCI YouTube Channel is:
http://www.youtube.com/user/BlueCollarInvestor
Since we are in Earnings Season, be sure to read Alan’s article, “Constructing Your Covered Call Portfolio During Earnings Season”. You can access it at:
https://www.thebluecollarinvestor.com/constructing-your-covered-call-portfolio-during-earnings-season/
Best,
Barry and The BCI Team
barry@thebluecollarinvestor.com
Hi Americo,
There is absolutely no need for you to kick yourself or think you made a mistake. Disappointment in a down stock is normal!
But If there is anyone here who has never made a good faith buy of a volatile stock that went down I ask you to please step forward and finish this post for me….. 🙂
Hmmm, Americo, I see no takers :)! My joke is to make the point we all take risks that don’t work just as we all have stories about times when it did: we love our stories of stocks/options that went to the moon!
Yet many – not you, so I applaud you – have a tougher time telling failed moon shot stories. Speaking only for me the experiences that shaped my approach to the market the most were my loses. Winners take care of themselves.
A successful week to all. – Jay
Hey Jay,
Excellent response. Especially the joke.:)
I have shared some of my recent losses. However I have many going back over decades.
Back in the day when actual stock certificates were issued I kept a certificate wall of shame behind my desk of stocks that went to zero. Trading was a lot more difficult than it is now and I was a high risk trader then. Struck out a lot in order to hit the occasional home run. What I called the Babe Ruth trading strategy.;)
You are right that we learn more from our mistakes than we do from our successes. If I got degrees from this kind of learning I would have several Doctorates.:)
Hope all have a successful week.
Hoyt
Good morning Hoyt,
I have been in many small restaurants and businesses that have the first dollar they made framed on the wall.
For us I think your idea of framing things that went to zero is brilliant! I spent 5K once on a stock tip from a party and it went to pennies. I have kept it in that account and every time I log in I see it.
It is a purposeful reminder that this game is about risk, managing it and playing higher %’s. That’s where the rewards come from over time, as you well know! – Jay
Hey Jay,
Extremely rough day today.
Bought AMZN calls at 3:47 pm.
AMZN Nov 16 ’18 $1645 at $34.00.
Bought these with some of my profits from AMZN calls last week. But I used the exact obvious criteria than last week. Instead of buying on accelerating upwards price I am trying to catch a falling knife or a dead cat bounce.Calls have dropped $3.50 as of 3:55pm as I write this.
AMZN just dropped below 200 day moving average. I thought it would hold there.
This was a mistake. Tomorrow will be ugly on open.
Take care,
Hoyt
Thanks Hoyt,
Today was a mixed bag for me. I day traded SPX expiring puts and made money. I sold a Dec csp on IWM and XLV since I think they have a chance if the market comes back .But my core holdings got spanked as usual of late more than cc’s can cover.
I also did what I call my “Don Quixote Trade” where I buy a call on something off the wall in case it works. That is SPY in the morning and if that one works your AMZN should also.
May The Force be with us! Or the Farce :)? – jay
In looking at Summary from weekly report:
“IBD: Market in confirmed uptrend
GMI: 4/6- Bullish signal since market close of November 8th, 2018”
This looks like a whipsaw with more downside coming.
Best;
Terry
Terry,
I believe you are right.
I am staying 50% in cash, and waiting for the bull to come out of the fog.
Roni
Hey Terry,
A lot of whipsawing today.
Open wasn’t was bad as I thought it would be. I was really surprised by the futures about two hours before the open but they really fell as the open approached.
This is a very schizophrenic market. They say you are what you love so I guess I am getting schizophrenic.:)
It seems we all think the market is going lower. Sometimes group think is a contrarian indicator.:)
Good luck to us all.
Hoyt
Alan,
Like you, I also look at Dr. Eric Wish’s blog, his GMI (and GMI2) indicators etc.
I know that you know him personally and your text book is required reading for his class.
While he does not do Covered Calls, he does stay out of the market (avoid trading) when its as choppy/volatile as it has been recently.
You’ve been doing this for over 20 years – and you’ve seen some ups and downs.
So here are my questions:
1) When the market is volatile with no solid direction, do you still do (weekly/monthly) ITM covered calls? Or do you just stay out of the market till it finds its direction?
2) Back in late 2008-early 2009 – when the market was tanking, did you just sit it out as far as Covered Calls are concerned?
3) Lastly, in just stock portfolios (no option writing), do you also get out and stay out till general indicators show a solid general market uptrend?
Your feedback and experience is appreciated.
Await your response
Thanks
Rege
Rege,
We each must make our own decisions based on our personal risk-tolerance as to the market conditions appropriate for investing. For me, I am generally fully invested and take to using ITM calls and OTM puts in bearish and volatile conditions. There are other actions we can take to mitigate potential losses.
There have been certain circumstances when I went to cash. Examples include 2008 when I moved to cash in October 2008 and returned in March 2009, pre election 2016 (got right back in) and pre- Brexit (also got right back in). Looking back, I should have exited sooner (lost 15% that year) or turned to inverse ETFs.
I do have smaller “stock only” portfolios and locate “winning sectors” and their best-performers in down markets. Most of my stock investing, however, is with options.
Alan
Blue Chip Report for the December Contracts:+ 2 new files
Premium members,
A new Blue Chip report of Dow 30 stocks eligible for option-selling has been uploaded to your member site. You will note that 3 stocks were eliminated and 3 new ones added from last month’s watch list.
Look in the “resources/downloads” section of your member site and scroll down to “B”
In that same section, check out 2 new files titled “Mean Analyst rating” and “On Balance Volume” as these metrics will soon be added to your premium member weekly stock reports. These statistics will add additional institutional components to our screening process.
Alan
Alan hello. I’m trying to access ask Alan #152 without success. The error is video is unavailable.
Regards and Thank you, Americo
Americo,
“Ask Alan” 152 will be posted tomorrow. New AA videos are posted the second Wednesday of each month. I hope you enjoy and benefit from these broadcasts.
Alan
Allan,
I’m in a quandary and seeking your advice. I’m long At&t at 33.50, it closed today 11-13-2018 at 30.60. I just bought back my 10 contracts of the Nov 30 call option at .02, which I initially sold at .11, thereby sticking to your 20/10 buy back rule.
However, now I would like to write more OTM Nov or Dec calls, but the premiums are almost nonexistent. I’m bearish to neutral on the stock right now. Should I sell the ITM calls on this stock?? I do not see how that would make sense though, since I’d be taking a hit on the stock price. Please advise.
Best,
Rafaelle
Rafaelle,
The near-the-money strikes (both ITM and OTM) will return between 1% and 2% for the December 21st contracts. This represents time value returns so the intrinsic value of the ITM strikes will bring down your cost-basis.
Since you are neutral-to-bearish on the stock consider favoring ITM strikes.
Use the multiple tab of the Ellman Calculator to visualize time value returns, upside potential (should you choose OTM strikes) and downside protection (for ITM strikes).
All decisions are made based on current market value not some past value that no longer exists. I know that is difficult but this approach will benefit us in the long run.
Alan
Alan,
I have a question.
May I ask you, since last October, normally how many stocks are in your watchlist and eligible to buy?
I just need and average to know, during market down, is still enough stocks to trade or not?
Thanks
Keivan
Keivan,
In normal market conditions:
Stock report has 30 -60 eligible securities
ETF Report has 15 – 20 securities
Blue Chip Report (Dow 30) has about 10 – 12 securities
In bear markets:
The numbers are cut in half
In extreme bear markets (rare) the 3 reports may total 20 securities.
Alan
“2 new files titled “Mean Analyst rating” and “On Balance Volume” as these metrics will soon be added”
Regarding the analyst ratings, I thought that analyst ratings are predominantly Buy so that they can make their commissions?
Best;
Terry
Terry,
Let’s give the analysts the benefit of the doubt. There are “bad actors” in every profession, but, in general, I believe there is value in viewing the combined analyst reviews and that they do provide a valuable service. Each member can determine how much weight to dedicate to MAR.
As an example, I’ve included a current screenshot of the MAR for NFLX showing a dichotomy of opinions with an overall “buy” rating.
CLICK ON IMAGE TO ENLARGE & USE THE BACK ARROW TO RETURN TO BLOG.
Alan