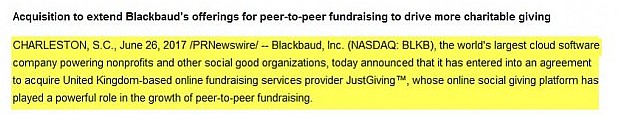
Position management is one of the 3 required skills needed for covered call writing and put-selling. When share price gaps up or down there is a strong possibility that an exit strategy opportunity will present itself. There are times, however, when no action is the best action. On June 26th, 2017, Luis contacted me about Blackbaud, Inc. (BLKB) when it gapped down from nearly $90.00 to $85.60. This tends to create a sense of urgency in us to act quickly to mitigate losses. It is important to stick to our game plan so that we make non-emotional decisions based on sound fundamental, technical and common-sense principles.
Price chart of BLKB showing the gap-down (sent from Luis)

BLKB Price Chart Showing 6/27/2017 Gap-Down
What caused the gap-down?
We first check the news to see the etiology of the price decline. In June 2017, tech stocks were volatile and declining after a meteoric rise the previous few months. The news events also showed an acquisition by BLKB which just happened to be made public on June 26th:
Price chart of the $90.00 call option
So far there appears to be no reason to panic and act immediately. Remember, we always have our 20%/10% guidelines to guide us when to buy back our call options. let’s look at a price chart of the 1-month $90.00 call option to see how it was impacted after the news announcement:

BLKB $90.00 Call Option Price Chart
The yellow field depicts a slight decline in option value on the 26th despite the price decline. Knowledge of the option Greeks may offer an explanation. Delta is the amount an option value will decline based on every $1 of share price decline. But option value only dropped by about $0.05. A major factor is that when price declines significantly, the implied volatility rises and this will enhance the value of the option. This is analogous to our study of the S&P 500 which is inversely related to the VIX. Based on this chart, the 20%/10% guidelines are not met.
Location in contract month
Another factor that dictates what, if any, action is required is the number of days remaining in the contract. After June 26th, there were still 19 trading days remaining until expiration of the July contracts leaving plenty of time for price recovery or appropriate use of our exit strategy arsenal.
Price movement by end of July 2017 contract
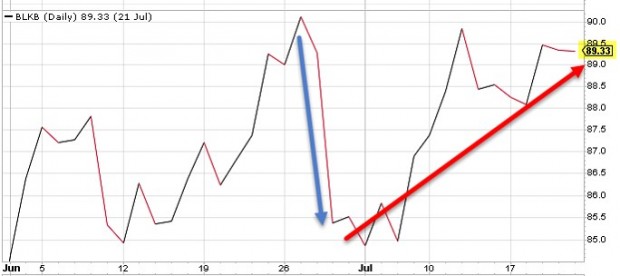
BLKB Gap-Down and Price Recovery
After the gap-down (blue line) the price fully recovered to $89.33 (red line) by the end of the July contracts. If the price continued to decline, the 20%/10% guidelines would have resulted in closing the short calls.
Discussion
When there is a price gap-down in share value we must act or take no action based on a non-emotional analysis. This includes:
- Checking the news regarding the reason for the gap-down
- Analysis of option value in relationship to our 20%/10% guidelines
- Days remaining until contract expiration
Having a structured approach to investing will allow us to make our decisions without being influenced by two of our most egregious enemies: fear and greed.
New Premium Stock and ETF Video User Guides
Just added to membership link on these web pages (click on link at top of this page or click here) and to the premium member website:

Premium Stock and ETF Video User Guides
HOLIDAY DISCOUNT COUPON: PROMO CODE “HOLIDAY10”: Holiday gifts at a discount
The BCI team is thanking our members with a 10% discount off all items in the Blue Collar store for all orders placed from now through December 24th. Use promo code holiday10 to receive the 10% discount at checkout. Premium members, enter the store from the premium site to receive your additional member discount.
Upcoming speaking event
Orlando Money Show
February 8th – 11th, 2018
Market tone
US stocks moved up this week with the CBOE Volatility index closing up at 11.32. The Senate’s passage of the tax bill late Friday evening may give a boost to the stock market on Monday as it offers favorable financial implications for large corporations. It now goes to conference with the House before it can be signed by the president. This week’s economic news of importance:
- New home sales for October reported at 685,000, above expectations
- The Case-Shiller home price index for September increased by 6.2%
- Consumer confidence index for November was 129.5 above expectations
- GDP for the 3rd quarter reported at 3.3%, as expected
- Jobless claims for week ending 11/25 was 238,000 below expectations
- Consumer spending for October was +0.3% above expectations
- Core inflation was 0.2%, as expected
- ISM manufacturing index was 58.2, showing expansion
- Construction spending for October increased by 1.4%, above expectations
THE WEEK AHEAD
Mon Dec 4th
- Factory orders (Oct)
Tue Dec 5th
- Trade deficit
- Markit services PMI
- ISM nonmanufacturing index
Wed Dec 6th
- ADP employment
- Productivity Q3
Thu Dec 7th
- Weekly jobless claims (12/2)
- Consumer credit
Fri Dec 8th
- Non-farm payroll
- Unemployment rate
- Consumer sentiment
For the week, the S&P 500 rose by 1.53% for a year-to-date return of 18.02%
Summary
IBD: Market in confirmed uptrend
GMI: 6/6- Buy signal since market close of August 31, 2017
BCI: My portfolio makeup remains in a neutral bias, selling an equal number of out-of-the-money and in-the-money calls.
WHAT THE BROAD MARKET INDICATORS (S&P 500 AND VIX) ARE TELLING US
The 6-month charts point to a neutral outlook. In the past six months, the S&P 500 was up 2% while the VIX (11.32) moved up by 11%.
Much success to all,
Alan and the BCI team
Allen…
Why would you buy back an option that has gone ITM
to avoid being exercised?? Don’t you still get the stock
appreciation of the strike plus premium ??
Dave
Dave,
Yes you are 100% correct. If we sell an OTM strike that moves ITM by expiration due to share appreciation, we generate option premium + share appreciation up to the strike price.
The reasons we may decide to buy back (and roll the option to the next month) include:
1. We still like the stock and rolling the option results in a time value return that meets our goal.
2. Selling the shares may result in negative tax issues if we are trading low cost-basis stocks in non-sheltered accounts.
3. One less trading commission than “allowing assignment” and re-buying the stock after expiration.
Alan
Alan,
Should I close my position on LRCX at a certain point. Currently is 186.61, How does 20/10% guideline work?
PUT LAM RESEARCH CORP $190 EXP 12/15/17
Thanks,
Alp
Alp,
The 20/10% guidelines are based on the current value of the option sold compared to the price generated from the original option sale. For example, if we sell an option for $3.00, we automatically buy it back (buy-to-close or BTC) at $0.60 or less (20%) in the first half of the contract if option value reaches that threshold. We can even place this BTC order immediately after placing the initial covered call trade. We change this BTC order to $0.30 (10%) in the 2nd half of the contract. See the exit strategy chapters in my books/DVDs for more details and real-life examples.
Alan
Premium Members,
This week’s Weekly Stock Screen And Watch List has been uploaded to The Blue Collar Investor Premium Member site and is available for download in the “Reports” section. Look for the report dated 12/01/17.
Also, be sure to check out the latest BCI Training Videos and “Ask Alan” segments. You can view them at The Blue Collar YouTube Channel. For your convenience, the link to the BCI YouTube Channel is:
http://www.youtube.com/user/BlueCollarInvestor
Best,
Barry and The BCI Team
barry@thebluecollarinvestor.com
Premium Members,
There was a typo in the earlier upload. Please use the report dated 12/01/17-RevA. Gary, thank you for spotting the typo.
Best,
Barry
Thanks Alan/ Mario for guiding me to the correct percentage return, but Alan I will need you to go over something minor with your last calculation on the previous article.
So even though I have the right calculation formula for the next month’s initial return, there still is something missing in the returns that hasn’t been explained.
– What I mean is what happens with the -0.06c difference in stock price, from the $17.73 at 1st months expiry, to the $17.67 when I resold the $18C at start of next contract (next day or so.)?
– Does this slight -0.06c stock loss get deducted off the 1st months end return? (so that 1st months end return is calculated down to $17.67 instead, and not the actual expired price of $17.73?)
(I thought you had once told me (although wasn’t entirely sure) just to deduct this difference in stock price off the next months premium, I hope your correct method hadn’t changed?)
I will try submit all this from my computer, if it doesn’t work then I may have to look at changing I.P address.
Is this a good idea you think?
I’ve sent off comments here for years, so don’t understand why it shouldn’t work- but I can on another computer(?)
Thanks for your help again.
———————————————————————————
And thanks Mario for all your very helpful calculations.
It is very detailed and quite overwhelming too, although I do need to say that even for the fact I know most of what returns you came up with, the crux of the calculation question for me was as I wanted to know above – where did the “- 0.06c stock loss” get factored into this 2 month return?
Also I submitted last comments from other computer, and for mine I just did as you said – cleared caches, cookies, etc, and it still hasn’t worked, so am unsure just yet.
Adrian,
.*******************
Regarding your Trade returns:
Alan may have a different answer from his perspective.
A. At Entry Date Gain or ROO% = 1.28% as long as LP>=18.00
B. At Expiration LP = 17.73, Worthless, Gain = (17.73-1777)/18 = -0.22% (I did not calculate this earlier)
C1. At Leg in, LP = 17.67, BEFORE trade, you lost another $.06 or -.06/18 = -.33% additional loss, giving you a new Total net return of -0.56% (-0.22% -0.33%)
C2 At leg in, LP = 17.67, After Trade is filled: You added $0.25 income or .25/18 = 1.39% Adding to C1 above give a Total net return of 0.84% which agrees with my previous blog input. Notice the cost basis is 18, referencing your original investment l Entry cost basis.
Using the Ellman calculator uses 0.25 / 17.67 for an entry OTM ROO% of 1.415%.which as Alan states is useful for investment decisions at the time of the investment or trade.
.*******************
Regarding you inability to post responses from your computer.:
I am not always perfect in giving the initial right answers after 50 years of design experience and 22 years of TCP/IP network work and shenanigans – sometimes you have to struggle through it and eventually get the solution as you try different alternatives. That is the way it is. I love it when I help to eventually solve a problem for a computer user.
Here are some commands you can try from a Command Prompt (admin) window (Win+R, select command prompt (Admin) You will then be logged in as administrator to execute the below commands. Search in internet for more information.
none of the commands are dangerous as I list them to perform unless I indicate that.
You can try them in the order listed.
You can compare the results from another PC for comparison purposes.
ping https://www.thebluecollarinvestor.com (should return a replies with the ipaddress 132.148.85.235 for the BCI servers. (On some systems the local pc or router or firewall may block pings.) Ping /? give you help commands
ipconfig (this will list your current ip address information) (ipconfig /? give you help commands
ipconfig /all (more detailed information for all interfaces)
arp -a (lists physical addresses in your network as recognized by your local pc) arp /? give you help information
ipconfig /release (releases current ip address) Disconnect your ip address in your local pc.
Ipconfig /renew (gets a new ip address from the DHCP server in your router) (this will usually give you the same IP address again from the DHCP server in your router). The reason the DHCP serve gives you the same ip address is because your router receives the machine address from your PC and looks it up in its tables. There is more to it to force a change to a new local ip local address. Don’t worry about that at this time.
I gather you have powered completely off and on your network router to reset all settings. The same with your computers.
ipconfig /displaydns ( this will display your domain names registered in the local DNS cache of your computer – you should see the https://www.thebluecollarinvestor.com in the list if you have connected to the website.
ipconfig /flushdns (this will clear the local DNS resolver cache)
ipconfig / displaydns (the list should show as cleared. If you just wait, you may see some new entries if you are connected to some websites from browser requests).
ping https://www.thebluecollarinvestor.com (this wlll obtain the BCI domain name ip address and store it in local cache. (this normally happens automatically as you go to different places on your browser)
ipconfig /displaydns (You should see BCI server in the list again) 132.148.85.235
ipconfig /registerdns re-Registers dns status and refreshes IP leases
Tip: use up, down arrows to scroll back and repeat commands easily, you don’t have to type them again
To exit command prompt DOS window, just type exit
Now try to post a comment on the blog and see if the above helps.
An idea is to try the commands on your second computer to verify there results and possible issues.
Good luck.
Mario
Adrian,
Until the underlying is sold, the price will remain in a state of constant change. The Ellman Calculator will determine, ROO, upside and downside based on current market value at the time of the trade.
If you wanted to calculate the “unrealized” total return from the previous contract month:
[Original premium + (Stock price at expiration – Stock price when trade was initiated)] / Stock price when trade was initiated
An easy way to calculate overall portfolio performance:
{[Total portfolio value at end of contract (stock value + cash)] – [Total portfolio value at start of contract]} / Total portfolio value at start of contract
For example, if we started a month with a portfolio net worth (stock value + cash) of $50,000 and ended at $52,000, our 1-month return would be 4%:
($52,000 – $50,000) / $50,000
In this latter calculation, the unrealized gain or loss in share value would be factored into the value of the stock at expiration.
Until the stock is sold that number will constantly change.
Alan
Thanks Alan for the good detailed reply, and I still do have both those formulas as a reference for me.
With that price situation from the expiry to the next days price, I think using the $17.67 cost basis as you first said is best for the following month. So then I can take the temporary price difference off 1st months return, – the price has to start from somewhere.
1. Are you always playing the B/A spread for the exit strategies when the stock is going down? (if yes, then I thought it more important to just set the order as soon as possible, then to waste time trying for some profit that may be less than the share loss?)
2. I have read an article and the guy says before buying stocks I should check the futures first, to ensure there’s not likely to be bad upcoming market news.
Do you suggest we all should view S&P500 futures in the morning too before buying?
Like what if the futures happened to show for instance a -2% pre-market open? (I think that would definitely put me off buying stocks in the coming expected day!)
3. Also would you know if it’s possible
for me to use a US Tax-sheltered account, as I am from another country?
Thank you.
Adrian,
I always play the bid-ask spread when the spread is greater than $0.10 but monitor it diligently and will place another trade within seconds if my limit order is not executed.
I believe that the current stock price has already factored in the possibility of upcoming good or bad news. I enter my trades between 11 AM and 3 PM ET to avoid early morning and late afternoon market volatility resulting from computerized institutional trading.
Please check with your tax advisor regarding tax issues in countries outside the US.
Alan
Alan/Barry,
I’ve been a new member for a few monhs now, and have used your premium report and methodology to trade CC and very happy with the results thus far.
Excellent video explaining the premium report. I watched it twice and didn’t see an explanation for the following: Could explain what exactly the dashed separation lines on the watch list signify? The legend only says “separates list by option months”.
What does that mean exactly????
Please give an example of the difference if a symbol is below or above those dashed lines.
Also what controls the order the stock symbols placed on the list. Doesn’t seem to be alphabetical, or by price, …. is it by rank, best to lease?
Thanks,
Andy
Andy,
The dashed line is used to identify the upcoming monthly expiration cycles. We then sort the stocks within the expiration month by ER date so the subscriber can ensure that they don’t enter a trade in the month that the stock has an ER date. For example, from the report dated 12/01/17-RevA:
Above the dashed line: WGO
– ER date is 1/18/18
– If we are in the December (expiration date is 12/15/17), then WGO is OK for trading in December
– If we are in the January options month (expiration date is 1/19/18), then WGO is would not be traded in January
– If we are in the February options month (expiration date is 2/16/18), then WGO is OK for trading in February
Below the dashed line: AMP
– ER date is 1/23/18
– If we are in the December (expiration date is 12/15/17) or January options month (expiration date is 1/19/18), then AMP is OK for trading in December and January
– If we are in the February options month (expiration date is 2/16/18), then AMP is would not be traded in February
In the white section, the symbols are sorted by ER date. In the pink sections, the symbols are sorted alphabetically.
Best,
Barry
Thanks Barry for that detailed explanation, it makes sense total sense to me now.
Andy
Hi Alan, great article as always! Where do I find the option pricing chart that you used in this blog? Thanks, Marta
Marta,
Glad you like the article. The option price chart came from Investools Toolbox, a paid service no longer available. Here is a free site and instructions where option price charts can be accessed:
FREE site:
http://www.marketwatch.com
• Enter stock ticker in search box, upper right
• Click on “options” at bottom of page
• Find strike and click on “quote” on the left side
• Graph of price history appears
• Can add a ticker of a stock or index for comparison
Alan
Cognex CGNX 2 for 1 stock split.
Paypal PYPL data breech.
Filled 20% rule BTC on PyPL at 10:05 this morning. Strange way how these stocks react to market conditions.
Mario
Terry and Mario,
PYPL has been a good one and you may be able to hit a quick double on it’s rebound after taking your sold options profits!
When it went down 6% on news I could not help but speculate in a tiny way and bought 2 ITM .8 Delta calls for next Friday. – Jay
Jay;
Good luck on your play.
Terry
Thank you Terry! I just put a stop loss under those two contracts to protect 50% speculative gains, will move it up if I can and use the money for Christmas presents :).
What a wonderful world it would be if all trades worked out like this one? But they don’t. So when I speculate/gamble I do it small.
The more important point is that covered call writers who followed Alan’s guidelines in this trade bought their calls back at a profit. They are now free agents in a quality stock that simply got zinged one day on a fluke news event unrelated to earnings or other fundamentals. Hitting a double for next week or just enjoying the bounce are nice choices to have! – Jay
Hi Terry,
all hell is loose.
Data breach, stock split, aquisition, and more…..
6 out of my 10 positions bought back at aprox. 10% of option premium, NFLX is almost there too.
Only 3 positions doing well.
Right now my total Market Value is down 3%.
Today is my first green day since last week.
I hope you are doing better than me.
Roni 🙁
Roni,
Please do not feel like the Lone Ranger :)!
This abrupt turn around in the growth area and shift to defensive stocks or cash caught me off guard too. I am having a tough couple weeks beeing overweight Tech all year and not selling as many calls for fear of blocking upside.
Not sure it gets any better immediately. Every seasonal chart I look at on the major indexes shows seasonal weakness now through Dec 15th then a rise into the first week of the year. I always find seasonal patterns interesting but I don’t hang my hat on them.
At least you had the loss mitigation of covered calls to keep your market value loss down to a manageable 3% this expiry so far. I am off 6% from what was a banner year high in the 20% range so my beta is just too high which underscores once again the importance of diversification and call over writing! – Jay
Jay,
Thanks for your kind support. Most welcome. 🙂
Yes, I thought I was well deversified, but it turns out I am overweight tech.
The main reason is that all the other bold tickers on the list were low premium (under 2% NTM), or low OI, etc.
Let’s see how it all ends next week, and let’s hope for a continued bull market in 2018.
Roni
Terry, Jay, Roni, Justin,
12/6/17 11:20am:
4 Accounts Portfolio:
I just looked back at last Expiration Friday 11/17/17 and my 4 accounts portfolio is down 1.9%. It is 1.8% down from Last Friday’s total value on 12/1.
From YTD, it is 21.4% – and this is the last month of the yearly period.
ETF Portfolio:
My Joint Trust account with just ETFs is not doing well at 1.55% from inception date but at least still better than 1.25% CD rates.
SMH down 3% from BEP (Semiconductor)
SOXX down 5% from BEP (Semiconductor)
EWZ down 6% from BEP (Brazil Equities) (recently had recovered in price but now down again)
LIT (Battery Lithium Technology): Still has an ROO% of 2.9% after rollovers in last 2 cycles.
I indicate the BEP points above because once I close the option leg (BTC) of a covered call to a long position, I adjust the Purchase price in my portfolios to the BEP so I can see how my whole position is doing, including the income from the sold calls.
Mario
Mario,
That is fine work keeping a steady hand on the helm in these choppy seas. Great numbers on your part!
You allude to an important point I try to keep in mind: the value of CC and CSP premium versus CD rates.
Yes, there is theoretically no risk in CD’s. But neither is there any risk in covering a stock position for a premium other than the risk you already took owning stock in the first place.
In the heady days of this market I strayed from the discipline of covering at least half of my portfolio each month for loss protection or income. I am getting reminded to do it now!- Jay
Comments on ETF Portfolio:
Even though it is YTD at 1.55% today, it is very sensitive to the 4 positions owned. Just 2 weeks ago on Expiration Friday 11/17/17 the YTD Gain was 6.83% or 11.8% annualized.
So I think it is positioned well and ready for a price swing in those positions.
I remember last years 2 month time period (at least for me) from 11/2016 to 12/2016. The Market did very well those last two months and perked up our portfolios to end up the year looking better. It’s a matter of averaging out those ups and downs over the year.
Looking back further I remember well while working in my career earning those hard earned dollars, I had no time to look at my investments seriously and they were in safe funds not taking advantage of those yearly gains being experienced in many Mutual funds, but I was satisfied.
We controlled our budget well, did not lease a car every three years but held them for many years. We were sitting pretty, with our 2 Social Security payments and the yearly combined RMD’s to meet our budget, including some money for a vacation. Not everyone is as fortunate, as it depends a lot on fate for all of us where you are in your future.
A frustrating point that I experienced was the 10 year period several years back where your funds essentially stayed flat in a 60/40 professionally managed account. If you looked at the year to year fund performances it seems like you missed out on a lot of opportunities.
I hope Alan’s methodology for managing your retirement funds continues to reach more in their working years so their funds do experience some magnificent returns by the time they reach retirement.
Mario
Mario,
Thank you for your always thoughtful post.
It occurs to me we are playing this game against SPY.
I find it helpful to compare my results on a frequent basis to SPY to see if I am just pissing in the wind :)? – Jay
Alan,
I had a question about some trades I made. When a stock gaps down, where is a good site to check news on the company? Thank you for the help.
Kerry
Kerry,
A reliable free site:
http://www.finviz.com
Alan
Reminder for Everyone with RMD Distributions in December:
Make sure you have enough cash in your account for your RMD (Required Miminum Distribution) for your IRA.
I understand ETRADE will cancel the request if you do no have enough cash when it is scheduled to be mailed out.. Not sure what Fidelity will do.
Mario
Mario,
It is a nice place to be as an age 70 and over investor to have to remind one’s self to plan for RMD’s after not having taken them or more already during the year to pay the bills!
Congrats on your success and money management – may the rest of us be as fortunate when that time comes :)! – Jay
Alan,
I’ve read in this blog that in 2008 you lost 15%, less than half of the market losses. Can you offer any advice to covered call writers how to avoid even this much smaller loss should we face another recession.
Thanks,
Jeff
Jeff,
I view 2008 as an aberration although a future severe market decline is possible it is less likely because of the market precautions put in place since that year. That said, looking back is much easier than when we are experiencing such a market loss (about 38% that year). I give myself a C- for the way I managed my portfolio that year and feel that I am a better investor for it. Things I should have done differently looking back:
1- Selling deep out-of-the-money puts before taking control of shares and then writing deep in-the-money calls (the latter is what I was doing that year)
2- Focusing in on inverse exchange-traded funds (if I was only that smart!)
3- Move to cash sooner than October of that year (say June or July to get a B+ grade)
Although I do not believe we are anywhere close to another 2008, these are the considerations I would suggest to mitigate such a scenario.
Alan
Hi Alan,
Something I have been meaning to ask you: when you split your strike selection – as you almost always do – between ITM and OTM is that intra-position or inter-position?
More specifically, if you hold 200 shares of ABC and 200 shares of XYZ and are currently writing equal % would you write one ITM and 1 OTM call on each (4 commissions) or write one stock all ITM and the other all OTM (two commissions)? And if it is the later how do you decide whether ABC or XYZ is the ITM or OTM write?
I can see a scenario where a member might have 10 stocks all with 100 shares each and need to pick 5 to write ITM and 5 to write OTM to follow your allocation. Is there a simple guide to decide which 5 either way? Thanks, – Jay
Jay,
I lean to a high percentage of OTM strikes for stocks with the strongest price charts. For example, if I was selling 3 contracts for Stock A and 3 contracts for stock B where A had a bullish technical chart and B had a mixed technical chart, I may sell:
A: 2 OTM; 1 ITM
B: 1 OTM and 2 ITM
This would be when I am looking to sell an equal number of ITM and OTM portfolio strikes. The overall portfolio mix hinges on overall market assessment (neutral in this hypothetical) and personal risk tolerance.
Alan
Dear Mr. Alan,
I have a question.
If you have normal bullish assumption on a stock, normally how many percentages out of the money you sell your call strike?
For example if the stock price is 100, you sell 101, 101.5 or 102?
I just need a benchmark.
Thank you in advance,
Keivan
Keivan,
When I sell a particular strike (out-of-the-money in your hypothetical), I base my selection on my initial time value return goals. Let’s say our goal was 2-4% per month for initial TV returns. This means that the strike should returns at least $2 and up to $4 (may go a bit higher in strong bull markets). I will look to the higher strikes that meet these goals in a strong bull market (perhaps the $102strike if the premium falls into the 2-4% range) and the lower end of the range in normal market conditions (perhaps the $101 strike).
Alan
Premium members:
This week’s 8-page report of top-performing ETFs and analysis of ALL Select Sector Components has been uploaded to your premium site. The report also lists Top-performing ETFs with Weekly options as well as the implied volatility of all eligible candidates.
New members check out the video user guide located above the recent reports.
For your convenience, here is the link to login to the premium site:
https://www.thebluecollarinvestor.com/member/login.php
NOT A PREMIUM MEMBER? Check out this link:
https://www.thebluecollarinvestor.com/membership.shtml
Alan and the BCI team
Alan,
By the nature of the BCI strategy, is it likely that stocks turn over monthly?
What is the typical amount of turnover?
Carl
Carl,
For traditional covered call writing (the way I approach the strategy) our portfolios will turn over 20 – 80% per month mainly due to avoiding earnings reports.
Exceptions to this guideline are portfolios consisting of exchange-traded funds, a strategy I use in my mother’s portfolio, and portfolio overwriting where we write calls only on long-term buy-and-hold portfolios.
Alan
great work alan