One of the mission statements of The Blue Collar Investor is to share information so that we can master option trading basics and become better investors. Many times I will research and write an article based on inquiries from our members and that is why I am able to continue to write weekly articles year after year. Today’s topic is an interesting one that we haven’t discussed in quite a while: put-call parity.
***This article has a few advanced concepts that I hope you find interesting but is NOT necessary to master or memorize. Some of the material may make your head spin a bit as it did mine as I was writing the article!
Definition and example
Put Call Parity is an option pricing concept that requires the time (extrinsic) values of call and put options to be in equilibrium so as to prevent arbitrage (Arbitrage is the simultaneous purchase and sale of an asset in order to profit from a difference in the price). It is when the value of a call option, at one strike price, implies a certain fair value for the corresponding put, and vice versa. The argument, for this pricing relationship, relies on the arbitrage opportunity that results if there is difference between the value of calls and puts with the same strike price and expiration date. Arbitrageurs would step in to make profitable, risk-free trades until the departure from put-call parity is eliminated. This relationship is strictly for European style options, but the concept also applies to American-style options, adjusting for dividends and interest rates. If the dividend increases, the puts expiring after the ex-dividend date will rise in value, while the calls will decrease by a similar amount. Changes in interest rates have the opposite effects. Rising interest rates increase call values and decrease put values.
Put-call parity graph
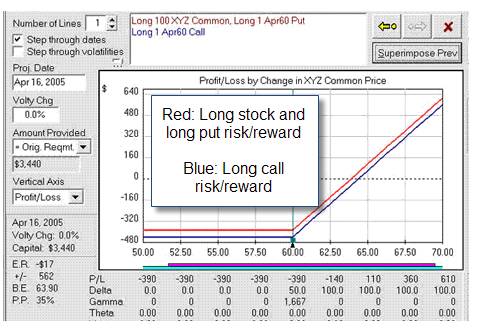
The above chart depicts a put-call parity relationship. We see that a long-stock/long-put position (red line) has the same risk/return profile as a long call (blue line) with the same expiration and strike price. The only difference between the two lines is the assumed dividend that is paid during the time to expiration. The owner of the stock (red line) would receive the additional amount, while the owner of the call (blue line) would not. However, if we assume no dividend would be paid to stockholders during the holding period, then both lines would overlap. From this chart one can see that if you sold a cash-secured put instead of writing a covered call, the put-call parity concept would account for that dividend difference.
When you buy a call, your loss is limited to the premium paid while the possible gain is unlimited. Now, consider the simultaneous purchase of a long put and 100 shares of the underlying stock. Once again, your loss is limited to the premium paid for the put, and your profit potential is unlimited if the stock price goes up.
Put Call Parity – An Example
Assumptions:
- BCI trading @ $50/share
- $50 call = $2
- $50 put = $2
- At expiration BCI still trading @ $50
The trades:
Buy 1 x $50 call for $200
Buy 100 x BCI and 1 x $50 put for $700
Results:
Calls expire worthless = $200 loss
Puts expire worthless, no loss or gain on shares = $200 loss
Since Put Call Parity exists, the net losses on both positions are exactly the same so that there are no arbitrage opportunity to be exploited by being long one position and shorting the other simultaneously.
Why are call premiums sometimes higher than put premiums?
Look at many option prices in which the stock price is close to the strike price. You are likely to see that put premiums are lower than call premiums (a dividend distribution prior to expiration will have the opposite effect). Are puts cheaper than calls? In fact, the time premiums of puts and calls at the same strike price (and the same expiration) are theoretically the same. Why then do call premiums usually appear to be higher?
The answer is that with the stock equal to the strike, the calls are considered in-the-money and the puts are out-of-the-money. This is because the real price of the underlying is the stock’s future delivery price, which is determined by the stock’s dividend and the current interest rate in addition to the stock price. If the interest rate is higher than the dividend rate (as it usually is) then the stock’s future delivery price will be higher than its current price.
As an example, if you are a market maker and you need to buy the stock (and guarantee a price) for one-year delivery (for a call we are writing), you need to borrow the funds (at the one-year interest rate) to buy the stock. This increases your actual price of the stock. However, you also collect the dividends (if any) on the stock. This will reduce your price. Thus, if the current stock price is $100, the one-year interest rate is 5% and the dividend rate is 1% annually, then the real cost of the stock for a one-year option is $104.
The equation therefore is:
Effective stock price = current stock price plus Interest minus Dividend
_______________________________________________________________________
An arbitrage opportunity: Why put and call prices are equal
If call or put time premiums get out of line with each other, option market makers can make a risk-free arbitrage profit. Here’s an example:
Let’s assume that the time premium of a particular put is greater than the time premium of the corresponding call (same stock, strike and expiration). Here the market maker can take advantage of the difference in the time premiums by selling the put and buying the call. What the market maker has done is to create a “synthetic” long stock position with a free credit of premium. The market maker can fully offset his risk by selling the stock. The net credit of time premium from this transaction will be his arbitrage profit.
Put/call parity rules: Synthetic trades (this is the head-spinning part!)
From the above paragraph, you get the first of the put/ call parity rules: If you buy a call and sell a put at the same strike price and expiration, you get the equivalent of a long stock position. These are the 6 rules:
Rule 1: (+) Buy Call & (-) Write Put = (+) Buy Stock
Rule 2: (-) Write Call & (+) Buy Put = (-) Short Stock
Rule 3: (+) Buy Stock & (+) Buy Put = (+) Buy Call
Rule 4: (-) Short Stock & (-) Write Put = (-) Write Call
Rule 5: (-) Short Stock & (+) Buy Call = (+) Buy Put
Rule 6: (+) Buy Stock & (-) Write Call = (+) Write Put = Covered Call
Notice that if you move any of these transactions to the other side of the equal sign, you change the strategy from a short to a long (or vice versa) and the “+” sign to a “-” sign (or vice versa).
Practical application of put-call parity
Since the market maker has a clear advantage in trading options, it is unlikely that the average blue collar investor will capture profit from “risk-free” arbitrage opportunities. However, these rules are helpful, because knowing them can help you determine what your strategy alternatives are. Here are two examples:
1- Let’s say you see attractive covered call opportunities, where the call is in-the-money. Here you may be reluctant to establish the position for fear of having the call exercised and perhaps be susceptible to tax liability. Here you can write a cash-secured put instead of the covered call (Rule 6).
2- Let’s assume you are interested in buying a particular stock, but you are concerned about the risk and may want to hedge it with a put. Knowing rule 3 tells you that buying the call will give you the same risk/reward as buying the stock and the put.
Put Call Parity – In the real world
As you might have noticed above, Put Call Parity requires that the extrinsic (time) value of call and put options of the same strike price to be the same. However, in reality, the extrinsic value of put and call options are rarely in exact parity in option trading even though market makers have been charged with the responsibility of maintaining Put Call Parity. When the outlook of a stock is bullish, the time value of call options tend to be higher than put options due to higher implied volatility and when the outlook of a stock is bearish, the time value of put options tends to be higher than call options. When the put option is valued much higher than the call, look for a dividend distribution to be the reason why.
However, such option trading arbitrage opportunities are rare even under Put Call Disparity as the presence of bid/ask spreads and commissions tends to neutralize gains from such disparities.
Conclusion
A put-call parity is one of the foundations for option pricing, explaining why the price of one option can’t move very far without the price of the corresponding options changing as well. So, if the parity is violated, an opportunity for arbitrage exists. Arbitrage strategies are not a useful source of profits for the average trader.
My next speaking engagement:
Market tone:
In 2012, a large percentage of the gain in the S&P 500 was due to the meteoric rise in shares of Apple Computer. Recently, AAPL has been heading south and yet the market continues to rise. This is impressive and corroborates this sites bullish stance on the overall market. Here are highlights of this week’s economic reports:
- In December, the Conference Board’s index of 10 economic indicators rose by 0.5% a bullish signal for the economic activity over the next 3 months. In addition, the November reading was revised upward from (-) 0.2% to 0%
- Stronger economic growth was also signaled by stock market gains and an increase in building permit applications
- Existing home sales (although down 1% from November) in December was up by 12.8% from one year ago
- Housing inventory in December fell from a 4.8 month supply to a 4.4 month supply, the lowest level since 2005
- In 2012, 4.65 million previously owned homes were sold, the best pace since 2007
- The national median home price was up 11.5% to $180,000 in December
- Sales of NEW single-family homes fell in December (from November) by 7.3% but November stats were revised higher to an annualized 398,000, the highest level in 3 years
- NEW homes sales for 2012 came in @ 367,000, 20% higher than 2011 stats and the first annual gain since 2005
- Median new home price came in @ $248,900, 14% higher than the previous year
- Initial jobless claims for the week ending January 19th was 330,000 lower than the 355,000 expected
For the week, the S&P 500 rose by 1.1% for a year-to-date return of 5.5%, including dividends.
Summary:
IBD: Market in a confirmed uptrend
BCI: Cautiously bullish favoring out-of-the-money strikes 3-to-2.
Wishing you all the best in investing,
Alan (alan@thebluecollarinvestor.com)
Weeklys:
Here is a trade one of our members shared with me:
Hello Alan,
You briefly mention weekly option expirations in one of your videos.
Here is a real-life example:
On Monday, January 28th, I will buy shares of RIMM at a price of $17.55/share. Or on or there about. Let us assume. I will then sell the February call options on that stock at the In-The-Money strike price of $15.50/share. The expiration date is February 1st. The automatic loss is $2.05/share($17.55-$15.5). The premium I receive is $2.29/share. So, $2.29-$2.05=.24cents per share gross profit before commission.
I studied the RIMM stock charts and I see that this stock last hit $15.50/share on January 18th. So I guess there is enough cushion for me and my comfort level.
I looked at RIMM and any other stock per your instructions about pending earning reports, liquidity, open interest, etc.
Thanks for all the education. In-The-Money Option writing could be the closet thing to the financial Holy Grail!
Premium Members,
This week’s Weekly Stock Screen And Watch List has been uploaded to The Blue Collar Investor premium member site and is available for download in the “Reports” section. Look for the report dated 01-25-13.
Also, be sure to check out the latest BCI Training Videos and “Ask Alan” segments. You can view them at The Blue Collar YouTube Channel. For your convenience, the link to the BCI YouTube Channel is:
http://www.youtube.com/user/BlueCollarInvestor
Since Earnings Season is in full swing right now, be sure to read Alan’s article, “Constructing Your Covered Call Portfolio During Earnings Season”. You can access it at:
https://www.thebluecollarinvestor.com/constructing-your-covered-call-portfolio-during-earnings-season/
Best,
Barry and The BCI Team
Fantastic article. I learned a lot from this and appreciate your making this subject understandable.
DHI:
One of our members wrote me today that she held DHI through the earnings report without selling the call (because of the BCI rule regarding ERs). A positive surprise resulted in an 11% share increase. With 13 trading days remaining until expiration Friday there is still an opportunity to write an out-of-the-money call for an additional 2% profit.
Nice going!
Alan
Hi Alan and friends…
January was a great month in the market for sure!
I do notice that the S&P500 looks overbought (RSI)…
Not sure how february will turn out… Will wait and see…
Alan, I have a few questions for you…
1) I notice that fear and greed tends to dominate the market… This has
always been the case… For example, before the new year I was chatting with a family member… He was saying that he thought the market was going to tank in January due to the fiscal cliff… This was the thinking of allot of people… But, as we now know in hindsight, the market was very bullish…
In addition, I remember at the end 08′, the was a radical amount of fear around… MASSIVE fear!! I remember one conversation I had with a few financial “experts” (at least they thought they were)… They said things like “The world is going down the drain” “Its coming to an end” “The sky is falling” ect…We now know in hindsight that this was around the best time to invest…
So, would you agree its best to turn away from the news??… Follow your system… Let the charts/ fundementals do the talking and quit letting peoples negative emotions influence our behaviour… After all, in most cases, if we listened to them, it would cost us allot of $$$…
2) Living in Australia, it makes it interesting trading the USA market… For one, I sleep when wall street is awake…
What alwo makes it interesting is the relationship between the USA/ AUD dollar… Currently, 1 AUD buys 1.04c US…
I looked at a chart of the S&P500 (monthly) and I notice the overall pattern of the chart looks very similar to that of the AUD/ US dollar chart…
Alan, Is there a connection??
In 08′, when the S&P500 tanked, the Aussie dollar only bought .60 USD… Since then both have risen…
My theory is if this is the case, and there is a connection between the 2, the BEST times to bring some funds back to Australia is when there is major market corrections… Then when the market gets back on its feet and is doing well (like now) it best to wire funds into US dollars…
What are your thoughts?
Thanks Alan
Dave
Dave,
We appreciate all our international members and certainly the large following we have from Australia. You make some great points and ask some excellent questions most of which I can answer:
1- Fear and greed is absolutely a factor in market performance and should be considered after we do our own analysis. Listening to experts on TV or your next door neighbor (he’s an expert too, right?) will just give you someone else’s opinion. Why not trust your own? When I am bullish on the market (as I have been for some time and archived in my weekly blog artciles) I will turn “cautiously bullish” when I feel a pyschological component may play a role like with the “fiscal cliff” This does not mean we should run from the market but perhaps use in-the-money strikes, low-beta stocks and/or ETFs.
2- I would absolutely NOT avoid the news. I look at the economic reports every week and especially earnings results quarterly. These reports are major factors in my overall market assessment. The difference here is that I interpret the news rather than have a talking point do it for me. Again, we can listen to what some of these experts have to say but then come to our own conclusions.
3- Eliminate emotion in our decisions…a big time YES to that one.
4- Here’s the one I can’t answer: The relationship between AUD/US and the S&P 500 as a criteria for our investment decisions. I haven’t studied this hypothesis but did create a chart below for the past year. It shows some time frames with great similarities and others (I highlighted in yellow) with an inverse relationship. Over the past year, there was not a direct relationship between the two. Long term, may be a different story but I haven’t investigated. Perhaps you can look at this and let our members know what you come up with. It will be interesting. I DO study the overall chart pattern of the S&P 500 along with that of the VIX which has had an inverse relationship with the S&P 500 over the long term. Click on the chart below to enlarge and use the back arrow to return to this blog.
Alan
Hmm, thats some really solid anwsers there Alan…
Thank you
The chart was interesting… I would say based on the evidence on the chart the relationship is fairly matched about 80% of the time…
Do you know where you can get free charts of the AUD/ US dollar with indicators ect??
Based on what you said about the news, I asume the news you are refering to ising your weeknight news and your newspapers…
I asume you are talking about company/ market news, right??
Personally, I trade a system that doesnt use the news… But perhaps that isn a weakpoint of mine…
By the way, how are things in the USA Alan?
I am actually making a trip over there later this year… First time ever…
Take care Alan…
Dave
David,
Yes, I’m referring to company and overall market news. I summarize the economic reports of the week in my weekly blogs and only companies with favorable ERs will pass our screens. I research an individaual company in more detail when unusual price action dictates.
Here are some links:
http://finance.yahoo.com/q/bc?s=AUDUSD=X
http://www.investing.com/currencies/aud-usd-chart
http://forex.tradingcharts.com/chart/Australian%20Dollar_US%20Dollar.html
http://finviz.com/forex_charts.ashx?t=AUDUSD
I live in NY and visit various cities in the US in my speaking engagements. My assessment is that things are improving slowly but getting better nonetheless after a rough recession. Many great places to visit here. If you’re planning to visit NY shoot me an email.
Alan