Several of our Premium Members have requested we provide sample portfolios based on the CURRENT Premium Watch List as a guide to assist in mastering the strategy of covered call writing. In today’s article I will use the watch list dated 3-8-13 (stats taken on Wednesday, 3-13-13). The stocks we select in general are based on several factors:
- Our personal risk tolerance
- Cash available for share purchase (GOOG may not be appropriate based on the amount of cash available)
- Our market assessment (We may favor high beta stocks and high implied volatility options in bullish market conditions)
- Nature of the other stocks already in our portfolio (proper diversification must be accounted for)
- Other factors we deem important (industry rank, dividend yield)
Therefore, whenever we provide a sample list of this nature, we will first describe the parameters this portfolio is based on. Remember, this is NOT a list of recommended stocks but rather a sample portfolio meant for educational purposes. Future sample portfolios will be based on different parameters so ultimately we will focus on a portfolio that applies to each of our members. In the future, these portfolios will be published and archived in the “resources/downloads” section of our premium site.
In this first edition we will make the following assumptions:
- $50 thousand cash available
- Conservative investor
- Market assessment is slightly bearish
- Personal risk tolerance is low
- This is a new portfolio with no other stocks available for covered call writing
- This investor favors bold stocks on the premium” running list” (although ALL stocks are eligible on the “running list” with the exception of the “gold” rows which indicate an earnings report announcement prior to the current expiration Friday)
First we eliminate stocks that show earnings reports due during the April contracts (WOR through KSU on our watch list). Next we check the options chains for the stocks in bold and eliminate those with insufficient option liquidity. Here is the BCI guideline:
We require an open interest (OI) of 100 contracts or more and/or a bid-ask spread of $0.30 or less. Thus far the process has taken about 10 minutes and resulted in an initial list as follows (stock and industry):
LL/Retail
EMN/Chemical
GMCR/Retail
TRIP/Internet
HTZ/Leisure
VRX/Medical
OPEN/Computer
WLK/Chemical
The reason we include the name and rank of the stock’s industry in our premium reports is to ensure appropriate industry diversification, one of BCI’s common sense principles. For example, in a portfolio of 5 equities will NOT select BOTH LL and GMCR since both reside in the “retail” industry segment.
Next we access the option chain information and since we are conservative investors with a bearish outlook and low-risk tolerance, we look for in-the-money strikes with solid returns and protection. We feed this information into the “multiple tab” of the Ellman Calculator:
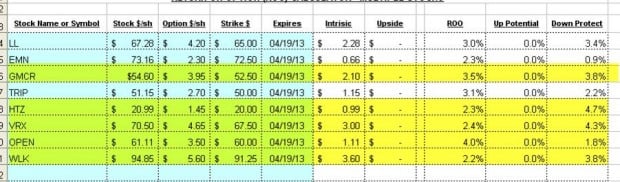
The Ellman Calculator
Of the 4 stocks in duplicate industries, I eliminated LL and EMN because they offered lower downside protection of the option profit than their counterparts in the same industry. Of the 6 remaining securities TRIP and OPEN had the lowest downside protections but GMCR had a better ROO (return on option) so I went with GMCR. The final 5 are highlighted in yellow.
Next, in keeping with our BCI principle of appropriate cash allocation we compute the number of shares to purchase:

Cash allocation calculations
This results in a cost of $50,172 + commissions, over our budget. So let’s eliminate 100 shares of HTZ resulting in a cost basis of $48,073. This will leave us $1927 (minus commissions) for exit strategy execution.
Here are the final stats for the initial returns on our sample portfolio:

Sample portfolio:final calculations
As you can see, we generate an excellent 1-month, initial return with outstanding downside protection of that profit. As always, we have our exit strategies in place in case needed.
I want to thank Sunil and other premium members who suggested the concept of sample portfolios as a learning tool for our Premium Members. I will periodically publish additional such portfolios in our premium site in the “resources/downloads” section. Scroll down to “Sample Portfolios” In the future I will alternate parameters and portfolio size so we will ultimately feature the parameters that coincide with the specific needs of ALL of our members.
My Next Speaking Engagement:
March 21, 2013 6:00 pm – 9:00 pm
South Florida Options Trading Meetup
Market tone:
This week the market showed a slight rise despite increasing gasoline prices:
- Retail sales in February rose by 1.1% much better than the 0.5% anticipated and up 4.6% year-to-year
- February’s Consumer Price Index (A widely followed indicator of inflation. The CPI is a measure of the average
change over time in the prices paid by urban consumers for a fixed market basket of consumer goods and services. The “core” CPI excludes food and energy prices, which account for roughly one-quarter of the broad CPI and tend to fluctuate widely, providing a truer reflection of inflationary trends) was up 0.7%, the highest since June, 2009. - Excluding volatile food and energy CPI was up a modest 0.2%
- Fed officials indicated that near zero interest rates would hold until unemployment drops to 6.5% as long as inflation isn’t projected to rise above 2.5%
- The University of Michigan’s consumer confidence index fell to 71.8 in March, a 15-month low, a product of higher payroll taxes and worries over the sequestration
- Business Inventories (A report of the dollar value of product inventories held by manufacturers, wholesalers, and retailers. Included in the report is the inventories/sales ratio, a gauge of the number of months it would take to deplete existing inventories at the current rate of sales, which is an important indicator of the near-term direction of production activity. The report’s formal name is Manufacturing and Trade Inventories and Sales) rose by 1.0% in January and up 5.6% from one year ago
- Industrial production rose by 0.7% in February well above the 0.4% expected
- Construction output was up 1.5% in February, rising for the 4th straight month
- Initial jobless claims for the week ending March 9th came in at 332,000 below the 350,000 anticipated
For the week, the S&P 500 rose by 0.2% for a year-to-date return of 10%, including dividends.
Summary:
IBD: Confirmed uptrend
BCI: This site remains bullish but favoring in-the-money strikes 3-2 until the sequester issue is put behind us.
My best to all,
Alan (alan@thebluecollarinvestor.com)
Allan,
I am a new member and was wondering why there are sometimes one and sometimes two entries in the industry rank column. Can you explain? Thanks a lot.
Frank
Frank,
If there are two entries, it means that the stock has been on he list for more than one week. The left letter is the current week’s rank and the right letter is the previous week’s rank. This gives some visibility into the direction and strength of the industry sector week to week. In a rough sense, it gives us an idea if there is any industry/sector rotation going on.
If there is only a single letter, it means that the stock is on the list for the first time or is back on the list for the first time after being removed from the list in the past. A single letter is the rank for the current week
Best,
Barry
Premium Members,
The Weekly Report for 03-15-13 has been uploaded to the Premium Member website and is available for download.
Also, be sure to check out the latest BCI Training Videos and “Ask Alan” segments. You can view them at The Blue Collar YouTube Channel. For your convenience, the BCI YouTube Channel link is:
http://www.youtube.com/user/BlueCollarInvestor
Best,
Barry and The BCI Team
Allan I was looking at vix options and noticed the call premiums were very high. What is the inherent risk of buying the vix and selling the call especially with the vix being relatively low right now?
Hamp,
The risk for many investors (perhaps not you) is not having a complete understanding of how these VIX products work. They are a COMPLETELY different animal from equity options. For example, they expire on a Wednesday, 30 days prior to SPX expirations. Also, they are European style options that can only be exercised on the day of expiration. They are calculated on expected volatility and do NOT factor in underlying price, interest rates, dividends and time to expiration as do equity options. You cannot “buy” VIX but can open a futures account and purchase futures contracts and sell options against these. Or you can purchase ETFs that include VIX in its focus (I’m not that familiar with these) such as VXZ and VXX and write calls against these. For most of us in the BCI community trading and writing calls using volatility as the underlying is not appropriate and really not necessary because we have so many equity choices. There are a small percentage of investors who may benefit from this strategy.
Alan
In the weekly stock list could you please recap where the “other” companies come from?
Thank you,
Bill P
Bill,
Although the IBD 50 is the screen I’ve had the most success with over many years, we need additional sources to end up with a watch list of 40-60 stocks. In my books and DVDs I make some suggestions such as IBDs CANSLIM screen, MSN Money Central’s site for Stock Power searches, companies that have stock splits, TV and radio programs and more. For our premium members, the BCI team has identified over 3000 stocks that have been and may be eligible covered call candidates. We screen that database (these are the “other” stocks) along with those in the IBD 50 (these are the ones that show the IBD rank on our premium watch list).
Each week, the BCI team re-screens over 3000 stocks based on the methodology presented in my books and DVDs and those results are published on the premium site.
Alan
Just saw the article on Sample Portfolio and was wondering about selling a PUT instead of buying the covered call.
For this sample portfolio,as an example, you show buying the 20 covered call on HTZ. You could also just sell the 20 PUT and put down less money to purchase the call and have the same risk don’t you????
Jim,
Selling cash-secured puts and covered call writing have similar risk-reward profiles but are slightly different. I consider cc writing a more bullish strategy in that additional profits can be captured by selling OTM strikes. CC writers also capture corporate dividends while put sellers do not although put/call parity may partially or fully level that playing field. One concern for put sellers is if early assignment occurs on a falling stock. If the seller does not have “shorting privileges” (which most retail investors do not have) it may be a day later before the shares hit the account to be sold before further price decline. This is rare but possible . In addition, many brokerages will not permit put selling in sheltered accounts as they do cc writing and put selling usually requires a higher level of trading approval.
As far as the investment amount is concerned, most brokerages will require the investor to have the cash in the account in case the stock is “put” to the seller so the investment is usually the same.
In a bear market environment, put selling may allow the investor to enter a cc trade “at a discount” by selling the call after the stock is put to you at the strike price minus the premium captured.
Alan
Jim,
Another point to consider is that you don’t have all of Alan’s exit strategies available to execute if the trade does not work out according to your market view.
Barry
Alan,
As part of the premium membership have you thought about maintaining a sample portfolio and sending out trade alerts?
Dave,
The BCI team is in the process of evaluating several additional products and services based on member feedback. We are NOT financial advisors but can offer many additional educational features to broaden the education and support our members deserve.
Keep an eye on this site for updates.
Alan
BCI’ers,
Don’t forget…today is the day that “Mini-Options” begin trading. The stocks that will trade these new options are: AAPL, AMZN, GOOG, GLD, and SPY.
Best,
Barry
Hitting a double:Congrats to Andy:
Hi Alan,
Firstly I want to thank you for the great book, The Encyclopedia of Covered Call Writing. I have learned so much from it.
I have been paper trading over the last month and am continuing this month. It’s funny because I was able to “hit a double” as you say on BAC last month. I bought 100 shares at 12.20 and sold the March 12 ITM call for .49 cents. The stock went way down and I bought the option back following your 20% rule (in the first half of the cycle) for .09 cents. The stock then went straight back up the following week and i re-sold the 12 call for .46 cents. The option ended ITM and I let it get called away. So I ended up getting 2 incomes from the same call, pretty cool!
Tried to listen to your recorded webinar from last week. I am not a member of the money(whatever the name is) so I wasn’t able to watch it yet. Is it available somewhere else to watch?
Linda,
The webinar is owned by The Money Show. I was an invited guest. You can become a member of the site for free and then access the webinar. Here’s the link:
http://www.moneyshow.com/video/Webcast/101/EB221E20AE4C45CCAC0960D45DB598731/Creating-Monthly-Cash-Flow-with-Covered-Call-Writing/
You can also take the Beginners Corner tutorial on this site (link on upper right) as it is similar.
Alan
Premium members:
This week’s 6-page report of top-performing ETFs and analysis of ALL Select Sector Components has been uploaded to your premium site. The report also lists Top-performing ETFs with Weekly options.
For your convenience, here is the link to login to the premium site:
https://www.thebluecollarinvestor.com/member/login.php
NOT A PREMIUM MEMBER? Check out this link:
https://www.thebluecollarinvestor.com/membership.shtml
Alan and the BCI team