One of the common mistakes made by covered call writers and put-sellers is to make investment decisions based primarily on the highest premium returns. Certainly, we all want to generate the highest levels of success but only when factoring in the risk we will be incurring. This article will look at high premium returns from the perspective of the underlying security as well as from the perspective of the “moneyness” of an out-of-the-money strike.
Time value profit and implied volatility of the underlying security
Our time value percentage profit is directly related to the implied volatility of the underlying security. This means that the higher the percentage return, the greater the downside risk. Generally, implied volatility (IV) statistics are based on a 1-year time frame and 1 standard deviation (accurate two-thirds of the time). If a stock shows an implied volatility of 25% and is trading at $60.00, the expected price range over the next year would be between $45.00 and $75.00, 67% of the time. Another $60.00 stock with an implied volatility of 10% would have an anticipated price range of $54.00 to $66.00. There is no need to look up or calculate implied volatility stats because we can glean the degree of risk by looking at our option returns based on our cost basis. I set a goal for initial 1-month returns for near-the-money strikes of 2-4% per month. I will go a bit higher in bull market environments (up to 6%). In my mother’s more conservative portfolio, I set a goal of 1-2% for 1-month returns. Below is a screenshot of a section of the BCI Premium ETF Report for exchange-traded funds. Pages 7-8 shows the implied volatilities which can be compared to that of the overall market (S&P 500):

Implied Volatilities from the BCI Premium ETF Report
With the IV of the S&P 500 at 7.76 (red arrow), the screenshot shows some ETFs having slightly less than double that implied risk (purple) and some triple to quadruple the risk (brown) of the S&P 500. Investors with a low risk-tolerance will tend to favor securities like ASHR, EWI and EEM.
“Moneyness” of out-of-money strikes
When we are bullish on the market and on a specific stock, we favor out-of-the-money strikes which generate time value returns and allow for additional share appreciation up to the strike price. Frequently investors will simply decide based on the strike that is above but closest to current market value. These strikes will tend to generate the highest initial returns but offer little or no opportunity to take advantage of share appreciation. In August 2017, Exact Sciences Corp. was trading at $38.66 and we viewed an option chain for the $39.00, $40.00 and $41.00 out-of-the-money strikes. Here are the calculations generated by the multiple tab of the Ellman Calculator:
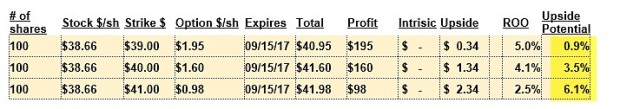
EXAS Calculations
Looking at the return-on-option column (ROO), the 5.0% ROO for the $39.00 strike seems like the best choice. However, if we look at the “Upside Potential” column (highlighted in yellow) we see additional opportunities to generate cash. The deeper out-of-the-money strikes offer lower ROOs but higher upside. In a firm bull market, we have an opportunity to generate a 1-month return of 8.6% (2.5% + 5.1%) for the $41.00 strike whereas the $39.00 strike will generate a maximum of 5.9% (5.0% + 0.9%).
This is a valuable instructive scenario as the IV of the underlying is similar for the 3 strikes and Theta (time value erosion) will also be comparable for all 3 strikes but yet the premiums are different. This relates to Delta which will be different for each strike. Near-the-money strikes have higher Deltas than deeper out-of-the-money strikes and this accounts for the price difference. Implied volatility is a critical factor in our covered call writing decisions but not the only factor.
Discussion
Upcoming speaking event
POINT, or Phoenix Options Investors Networking Traders,
Friday March 2, 2018 6:30 PM to 9:00 PM Rio Salado Community College 2323 West 14th Street · Tempe, AZ
American Association of Individual Investors: Phoenix Chapter
Saturday, March 3, 2017 9:00 AM Registration/Social Time 9:00 AM Refreshments Time 9:30 AM Program Time Location: Jewish Community Center 12701 N. Scottsdale Road Scottsdale, Arizona 85245 DIRECTIONS: The Center is 3.66 miles south of 101 on Scottsdale Road. The Center is on the left as you drive south from 101 OR Take 101 to E. Cactus. Drive 2 miles west on E. Cactus to N. Scottsdale Rd. Turn right on N. Scottsdale Rd. The Center is 1/8 mile on…
Great to meet so many BCI members at my Orlando Money Show presentations

All Stars of Options Event
Market tone
This week’s economic news of importance:
- Jay Powell sworn in as Fed chair
- Markit services PMI Jan 53.3 (expansion)
- ISM non-manufacturing index Jan 59.9% (above expectations)
- Foreign trade deficit Dec $53.1 billion (above expectations)
- Consumer credit Dec $18 billion (last $31 billion)
THE WEEK AHEAD
Mon Feb 12th
- Fed budget Jan
Tue Feb 13th
- Household debt Q4
Wed Feb 14th
- Consumer price index Jan
- Retail sales Jan
Thu Feb 15th
- Weekly jobless claims through 2/10
- Industrial production Jan
- NAHB homebuilders index Feb
Fri Feb 16th
- Housing starts Jan
- Building permits Jan
- Consumer sentiment Feb
For the week, the S&P 500 declined by 5.16% for a year-to-date return of (-) 2.02%%
Summary
IBD: Market icorrection
GMI: 1/6- Sell signal since market close of February 7, 2018
BCI: Due to the market volatility, I will be selling only in-the-money calls until market volatility subsides. I remain bullish on the economy and the market moving forward.
WHAT THE BROAD MARKET INDICATORS (S&P 500 AND VIX) ARE TELLING US
The 6-month charts point to a slightly bearish outlook. In the past six months, the S&P 500 was up 6% while the VIX (29.06) moved up by 160%.
Wishing you much success,
Alan and the BCI team
Is there a way to search the blog for a topic? I thought someone posted how to do this at one time. I have not found a way to do this.
Thanks;
Terry
Terry,
Use the Google search tool at the top of our web pages. Enter the topic you are interested in and it will pull up all the articles I have published regarding that subject.
Alan
Alan,
Thank you for a very informative Master Class this week, I look forward to practice using then new tools you presented.
Chuck H
Thanks Chuck,
My hope is that the information plays a role in cash generation for you and your family for years and decades to come.
Alan
Hi Alan,
I have been using the BCI stock and ETF weekly screens for the past 6 months, and have been earning between 1.5 and 2.5% monthly writing covered calls. During the past 7 trading days the value of my portfolio has dropped 11%. Some of my covered calls expired on Friday out of the money, and were thus not assigned. I could write new covered calls on these securities, and gradually recover some of my portfolio’s value in the coming year. On the other hand, I could simply hold on to my securities in hopes that share prices will rebound in the near future. Do you have thoughts on how best to proceed in these volatile market conditions?
Thanks,
Dave in Sacramento, CA
Dave,
As I replied to Kerry last week, when our stocks gap down due to overall market decline and not corporate fundamentals or negative news, it is reasonable to retain the shares and write out-of-the-money strikes. Panic cannot be part of the equation. Corporate earnings, the US economy and global economies are all healthy and the new tax plan favors continued corporate success. US politics remains my concern but the market has proven resilient in this regard.Here is a link to an article I wrote several years regarding this matter:
https://www.thebluecollarinvestor.com/covered-call-writing-managing-stocks-that-have-gapped-down/
Alan
Alan,
I’m new to options. I have been following my uncle selling covered calls now for about a year. And after seeing his success, I want to do it too. I have been watching your videos on selling covered call options. And I like your teaching style. Reminds me of a professor I had in college.
So it says in your disclosure not to email you for advice. But what would you recommend I buy as educational material from you to start out? I have purchased a stock and once it is set up with TDAmerica I feel fairly confident starting the process.
Thanks. Paul
Paul,
Here are links to our most comprehensive educational package for covered call writing and a Plan B:
https://www.thebluecollarinvestor.com/package-complete-encyclopedia-dvd-series-1-month-free-membership/
https://www.thebluecollarinvestor.com/alan-ellmans-complete-encyclopedia-for-covered-call-writing-scover/
Please take your time and make sure you have mastered every aspect of this strategy before risking even one penny of your hard-earned money…it won’t take that long.
Alan
Hey, I have a question. So if i sold to open an option on stock MU at a strike price of say 45, and during the cycle the stock is trading in the money and i want to buy to close, why would not the person who bought my option exercise it right away. i see in your examples of rolling out and in, you trade back and forth. But if it looking great for the stock going to the moon why would the other guy give me a chance to take back my option to sell? He/she can exercise the right to buy at any time during the cycle, correct?
Thanks
Paul
Paul,
Yes, you are correct that the option buyer can exercise at any time during the contract up to 4 PM ET on expiration Friday. These are American style options and, by definition, can be exercised at any time.
The reasons that early exercise is extremely rare:
1- Exercising early results in capturing intrinsic value (amount the strike is in-the-money) but the loss of time value. This means that the option holder will make more money by selling the option.
2- Most call option buyers do not intend to take possession of the shares but rather are hoping to make money on option appreciation if they are directionally correct about share price movement.
That said, early exercise is more likely (but still rare) when associated with an ex-dividend date).
Alan
Paul
Yes, the owner of the call can exercise the right to buy at any time during the cycle. But why would he?
If the call has any time premium remaining, he would get more for selling the call in the option market than exercising it and losing that time premium.
Secondly, why would he want to pony up the cash to buy the shares and risk a lot more money than having just that modest call premium at risk? As an example, you buy MU for $42 and sell the covered call for $1. If things work out and MU is over $45 at expiration, you make $4. The call buyer is betting on a larger move. All he has at risk is $1. Once the call goes in-the-money, why would he exercise the call to buy the stock for $45 and now have $46 at risk? He’ll just sit there with his $1 bet, hoping that MU goes higher and higher and sell the call when so inclined to book the profit.
Early exercise can occur at any time. It’s unlikely unless the call is ITM and trades below parity (the bid price plus the strike price is less than what the stock trades at). This discount is often caused by call selling prior to a dividend and sets up discount arbitrage which involves exercise.
I am down about $150,000 on BP in the last 2 weeks. I think BP is at or close to its support bottom. After I collect the 0.60 dividend this Wednesday, I am thinking of selling a series of 250 contract weekly puts 3 strikes OTM with a delta of about -0.30. If I get assigned , I would probably sell the stock and start over again. What do you think about this plan.
I plan on making your Phoenix meeting in April.
Thank You
Doyle,
If I understand your plan, you want to generate cash flow by selling out-of-the-money puts on a stock you believe is unlikely to decline in value. This plan makes sense but we should always be prepared to manage our positions should share value decline below the strike to mitigate potential losses. Also, have you evaluated Monthlys to allow for more management time and decrease the number and amount of trading commissions…both could work.
BTW: I’ll be in Phoenix March 2nd and 3rd.
Alan
30 delta options are sufficiently OTM to make the dividend irrelevant to the decision (it’s already priced into the puts).
Now, taxation. If assigned on the puts, unless you can effectively designate that your broker sell specific shares, you’ll be realizing the loss on the current shares if you sell. That assumes that down $150,000 in the last two weeks means you have a $150k paper loss rather than having given back $150k of profit. If not in the red then you’ll be realizing the gain.
Selling OTM uncovered options is a great plan if the underlying cooperates. If it doesn’t, NOT so much.
Hi Alan.
I want to offer my thanks for your services. I recently signed up for the Premium Membership and have read two of your books – Exit Strategies and The Covered Call Writing Encyclopedia. You have opened up a new world of investing opportunities for me!
I’m wondering if you would clarify a point for me? Because you recommend writing one month covered calls, does that mean the original options should only be written during the first week following the monthly options expiration date? For example, the February 2018 options expire on 2/16. Does that mean that new options should only be written during the week of 2/19?
I realize that once the call is written, BCI has rules for tracking and taking action during the subsequent weeks leading up to the next expiration date. I’m just trying to understand the timing of writing a new covered call position.
Thank you so much for the BCI program and answering my question.
Best regards,
Mike
Mike,
Due to Theta (time value erosion), I like to write new options at the very beginning of the new contract month. For 4-week contracts, I like to enter new positions on Monday or Tuesday after expiration Friday (some positions are “rolled” on or near expiration Friday). For 5-week contracts, we can wait a few more days but I usually stick to Monday or Tuesday for those as well.
Alan
Alan,
That is what I was assuming so your clarification is most helpful. I may have missed that point in your books and videos. As a new BCI member I have also been digging into the Ellman calculator tools and find them extremely valuable.
I have been impressed by the responsiveness of your service and the easy to comprehend manner of your instructional materials. As an aside, I have an MBA and an undergrad Finance/Economic degree from a major university and was never taught any of these Options concepts. I wish had learned all of this earlier in my life. However, the good news is I have adult children and I plan to share this knowledge with them. Teach a person to fish…
Thanks again and keep up the great work.
Mike
Mike,
Thank you for your generous comments. One of the most rewarding trends I have been noticing lately is more seasoned investors bringing their children and grandchildren to educational events. It was quite noticeable at the recent Orlando Money Show I recently presented at.
Alan
Mike,
Complementing Alan’s comments on preferably writing your options during Week1 because Time Value is the highest, there is nothing to prevent you from writing options in Week 2,3 of a 4 week period or 2-4 of a 5 week period as long as the ROO% values are in the 1.5% and up area or greater than 2% early in the cycle and the price chart looks good with respect to the Breakeven point and favorable volatility swings.
I also sometimes wait for a good buying opportunity (dip in market) and often end up in early week 2 finishing up being 92% invested.
Mario
Alan,
Excellent article this week. I noticed that the current IV of the S&P 500 is this weeks ETF report (2/6/18) was 43.58 while the previous week’s report it was only 11.98.
I was wondering if your statement in this week’s article “Seeking the Highest Option Premiums is a Losing Strategy” which states:
Investors with a low risk-tolerance will tend to avoid securities like ASHR, EWI and EEM.
should read:
Investors with a low risk-tolerance will tend to select securities like ASHR, EWI and EEM (those with lower volatility).
or, alternatively:
Investors with a low risk-tolerance will tend to avoid securities like KWEB, XBI, GDXJ (those with higher volatility).
I am assuming that “low risk-tolerance” is an investor that tend to avoid high risk investments.
Regards,
Mario
Good catch Mario…corrected to the intended “favor”
Alan
If you look at the 44 strike in EXAS and assume the premium is $0.50, the ROO is 1.3% with an upside potential of 13.8% for a total of 15.1%. Although this looks a lot more attractive than the total result for the 41 strike, what’s the probability of achieving this total return for the 44 strike?
How do you balance the cash-in-hand that you get from the premium and the higher upside potential from the higher strikes to get a “reasonable” or optimum result?
(1) Selling a lower strike provides more premium, more downside protection with a lower potential profit.
(2) Selling a higher strike provides less premium, less downside protection with a higher potential profit.
The optimum result is attained by knowing what share price is going to do by expiration. Since that can’t be known, you have to find a balance between the two choices. What the motivation for the position, fear or greed? (g)
The delta of the option is an approximation of the probability that the option will expire ITM. Since delta is affected by implied volatility, that number can change significantly along the way. Higher IV has minimal affect on ATM options. It lowers delta for ITM and raises delta for OTM.
Probability of Touch is higher than probability of expiration ITM. Using an option calculator will give you an idea of the numbers.
Rick,
Adding to Spin’s excellent response:
As a guideline, we will use deeper out-of-the-money strikes when we are more bullish on share appreciation. We base this evaluation on overall market assessment, chart technicals and personal risk tolerance.
In bear and volatile market conditions, we favor in-the-money strikes that will provide greater downside protection as it lowers our breakeven points greater than ATM or OTM strikes.
Alan
Premium Members,
This week’s Weekly Stock Screen And Watch List has been uploaded to The Blue Collar Investor premium member site and is available for download in the “Reports” section. Look for the report dated 02/09/18.
Also, be sure to check out the latest BCI Training Videos and “Ask Alan” segments. You can view them at The Blue Collar YouTube Channel. For your convenience, the link to the BCI YouTube Channel is:
http://www.youtube.com/user/BlueCollarInvestor
Since we are still in Earnings Season, be sure to read Alan’s article, “Constructing Your Covered Call Portfolio During Earnings Season”. You can access it at:
https://www.thebluecollarinvestor.com/constructing-your-covered-call-portfolio-during-earnings-season/
Best,
Barry and The Blue Collar Investor Team
barry@thebluecollarinvestor.com
Trading 2 Monday 2/12/18 – Looked for a good roll down candidate for this first day of week 4 or 4 cycle. Found CRM with good option bid price.
Long position CRM ER 2/27:
Rolled down CRM (Salesforce.com) to Strike 109.
Original strike was 114 with Covered call 1/24/18 Purchase price 113.61. Return Cost Basis 113.61, Breakeven 111.45. ROO 1.9% Upside 0.4%.
Executed Week 3 Rule10% with GTC order Buy to Close on 2/8. New Breakeven 111.65
2/12/18 – Rolled down CRM. Last Price 108.32 Gain -3.0% before roll down. Executed roll down to strike 109. Premium 1.26 after commission (Bid /Ask was 1.13/1.32, filled at 1.28 after playing spread). New Breakeven 110.43 Gain after roll down -1.9% ((108.32 – 110.43)/113.61), a 1.1% reduction in position loss. Check Premium / RCB 1.26 / 113.61 = 1.1%)
If on Expiration Friday 2/16 position is assigned at strike 109,
with the upside appreciation from the roll down underlying price, shares will be sold at 109 and the new position gain will improve by 0.6% ((109/108.32)-1) and the new position gain will be ((109-110.43) / 113.16) =-1.3% (loss). Net reduction in loss with the roll down 1.1% + 0.6% = 1.7%.
If the price remains below 109, the option will expire worthless and I have till the Earnings date of 2/27/18 to sell the shares, hopefully at a good price peak and including the benefit of the roll down income.
Mario
Update on Roll down trade of CRM (Salesforce.com) 2/15/18 after Market Close:
CRM is at 111.69, above my roll down strike of 109. Just two days ago on 2/13, it was at 107.78, well below my strike. Some volatility.
If it stays above 109, I will let the trade be assigned (Earning Date in a few days) and take the 1.3% loss in the position and the 1.7% benefit of the roll down. My actual net dollar loss with 300 shares will be $443.08 (G% * RCB * Shares = -.013 * 113.61 * 300).
If I had not rolled down and assuming the last price stays at 111.69: My BEP was 111.65 after the 10% rule trade. With a last price of 111.69, my gain would be $0.04/share or 0% gain. Dollar gain with 300 shares is $12.
Mario
New webinar- just in:
I will be presenting a free webinar for the Options Industry Council OIC) on 3/22 @ 2PM ET
Here is the link to register for free:
https://event.on24.com/wcc/r/1601761/6C464B87CD0C7A4ADA711D117EED7372?partnerref=presenter
Alan
I couldn’t disagree more with your assertions in this article.”Upside potential” for price appreciation of a particular stock is exactly what it states…POTENTIAL. Covered call writers want guaranteed income and are less concerned with upside potential or selling a stock at all. In fact, most covered call writers will want to hold their shares and continue writing more and more options contracts for the INCOME from the premiums. Why chase peanut returns when you can chase high premiums with little downside risk?!? If the stock declines, simply hold the stock and keep writing options until you’re profitable on your long position before selling out of it. Duhhhhhhhh. One could probably retire with as little as $25,000 invested in the market place simply by owning shares and chasing high premium (volatile) stock options week after week after week all year long. Take $GME for example. The weekly options on these right now are ALL in the thousands of dollars for ONE CONTRACT. Buy 100 shares for roughly $25,000 and instantly write a weekly call option and collect $5k. The great thing is that there are ALWAYS a few stocks that are going bananas for one reason or another. If $GME options cool off, simply move to another stock, rinse, and repeat….$3-5k per week off your $25,000 investment could net you more than $200,000 per year!!!!! Retirement is achievable with very little monetary outlay if you know what you’re doing. Make sure to ALWAYS sell your options for MORE than you paid for them OR hold them and write against them until the amount received from the premiums have generated enough profit to allow for selling the stock itself at a loss….if your shares get called away, you’ll get your premium AND collect a profit on the sale of your shares. Talk about a WIN WIN WIN strategy!!!!!!
Matt,
I always welcome the comments of members of our BCI community even when they are directly contrary to the BCI methodology. There are many ways to make money with stocks and stock options and when an investor locates a methodology that works for them, they should stick with it.
That said, I would make this statement for all forms of option trading: There is no free lunch out there. There are institutional, sophisticated traders with high-powered computers, algorythems and quants taking the other side of our trades. They know what they’re doing and so should we, the retail investor.
I congratulate you on your success and wish you well in the future.
Alan
I have to say I agree. I typically work both sides of the coin. I place covered calls and if it exercises, then I’ll place a covered put the next week. I keep my spreads at points where I’m guaranteed a profit each week based on the sell and assignment price. It’s especially useful in an unstable climate where blue chips are trading somewhere in their 52 week range, but not at a peak or trough. Technically I do have one stock where I’m following it up from the trough and basically playing a game of badminton… each time moving slightly above the last call and put value. It’s netting me between $2000 – 5000 per week. Granted, I’ve only been using this strategy for 6 weeks, but I’ve made approx $16,000 in that timeframe.