Selling cash-secured puts is a low-risk option-selling strategy geared to generating cash flow and beating the market on a consistent basis. In certain scenarios an additional goal of buying the stock at a discount is added to traditional put-selling. This article will analyze such a dual-purpose trade proposed by Safi on April 23rd 2021.
A real-life example with NIO Inc. (NYSE: NIO)
SAFI was quite bullish on NIO and was seeking to sell a near-the-money or in-the-money cash-secured put to accomplish both goals. At the time, NIO was trading at $41.08 and the $41.00 (slightly out-of-the-money) and $43.00 (in-the-money) strike puts were being considered. Both contracts expired in 1 week on April 30th 2021. We will focus our initial trade evaluation using the $41.00 strike which showed a bid price of $1.88.
Option-chain for NIO 4/30/2021 expirations

NIO Option-Chain for 4/30/2021 Expirations
NIO initial calculations with the BCI Elite Put-Selling Calculator

NIO 1-Week Put Calculations
Note that the 1-week unexercised return NIO remains above the $41.00 strike) is 4.77% or 250.58% annualized over 52 weeks. This type of huge return reflects a high implied volatility and the first thought that comes to mind is to check for an upcoming earnings report. Sure enough, NIO was projected to report on 4/29/21, a day prior to contract expiration. The BCI earnings report rule requires us to avoid selling options if there is an earnings release prior to expiration Friday.
What should Safi do?
Start by taking no action (not entering the put trade) until the earnings report passes. If the NIO bullish assumption remains, sell an in-the-money or near-the-money put strike that meets the stated time-value return goal range (up to each investor, for me, it’s 2% – 4% per month or 1/2% to 1% per week). Post-report, the option-chain stats will be quite different than the one provided by Safi because the implied volatility will subside drastically as will the option premiums and our exposed risk.
What happened?
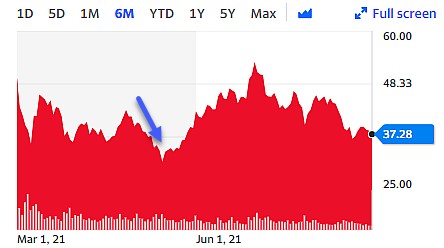
NIO Chart after 4/30/2021 Earnings Release
A disappointing earnings report resulted in a$10.00 per-share price decline (blue arrow).
Discussion
When establishing a put-selling strategy with the goals of both premium generation and purchasing the underlying security at a discount, we sell in-the-money or near-the-money cash-secured puts that meet our time-value return goal range. As with all our option-selling trades, earnings reports must be avoided.
For more information on selling cash-secured puts
Best online video course with workbook
Best option-selling calculator (calls & puts)
Your generous testimonials
Over the years, the BCI community has been incredibly gracious by sending our BCI team email testimonials sharing stories as to what our educational content has meant to their families. Moving forward, we have decided to share some of these testimonials in our blog articles. We will never use a last name unless given permission:
Upcoming events
1.Mad Hedge Traders and Investors Summit: Free webinar
September 15, 2021
11 AM ET – 12 PM ET
Covered Call Writing Blue-Chip Stocks to Create a Free Portfolio of Large Tech Companies
2. Wealth365 Summit: Free webinar
October 11th – 16th
Stock Options: How to Use Implied Volatility to Determine Strike Selection
Information and registration link to follow

***********************************************************************************************************************
Market tone data is now located on page 1 of our premium member stock reports and page 1 of our mid-week ETF reports.
****************************************************************************************************************


Mr Ellman,
Kindly provide your insight as to my thought pattern as to when to sell a put.
a) use an underlying i have no problem owning. If assigned, then to sell calls on it. Fundamentally strong underlying, i use mostly etfs
b) I’d rather NOT be assigned, so I’m selling puts on underlyings i wont be upset if assigned yet prefer not to be assigned, just collect the premium.
c) to use technical analysis to decide when to sell;
-RSI- oversold, below 30 on the daily.
-at or approaching resistance (support , 200 sma, more confluence the better)
-MACD histogram bars are getting smaller (assuming below the o line)
it doesn’t matter if its underperfoming the SPY
your thoughts sir?
Thanks and have a great day!
George
George,
Selling cash-secured puts is a fantastic cash-generating strategy and combining it with covered call writing creating a multi-tiered option-selling strategy is even better. The latter is known as the PCP (put-call-put) strategy in our BCI methodology.
Using only securities that we would otherwise not mind owning in our portfolio makes a lot of sense. I do the same thing in my put-selling portfolios.
Technical analysis is a critical aspect of our screening process. It is, however, only one of the 3 prongs we use for stock screening, fundamental analysis and common-sense principles (like avoiding earnings reports and diversification, to name two) should also be factored in.
For ETFs, we look to the charts and price performance over various time-frames. I prefer 1 and 3-month time-frame analysis. This gives us a near and longer-term perspective on how the security has been performing. Certainly there are other reasonable ways to technically analyze securities.
If we are selling 1-week or 1-month put options, we must factor in Theta or time-value erosion. So how long should we wait for the charts to align with our technical criteria?
Bottom line from my perspective: If we locate a security that we would otherwise not mind owning and if the price performance is stellar in near and longer-term perspective, I would enter my trades at the beginning of the new contracts.
Whether the charts or overall market assessment is bullish or defensive will influence our strike price selection.
Alan
Premium Members,
This week’s Weekly Stock Screen And Watch List has been uploaded to The Blue Collar Investor Premium Member site and is available for 03wnload in the “Reports” section. Look for the report dated 09/03/21.
Also, be sure to check out the latest BCI Training Videos and “Ask Alan” segments. You can view them on The Blue Collar YouTube Channel. For your convenience, the link to the BCI YouTube Channel is:
http://www.youtube.com/user/BlueCollarInvestor
On the front page of the Weekly Stock Report, we now display the Top Performing ETFs, the Top SPDR Sector Funds, and the 4 single Inverse Index Funds. They are sorted using the 1-month performances from the Wednesday night ETF report and the prices from the weekend close.
Please make sure that you review the new feature that we’ve added…Implied Volatility or IV. This is the At The Money (ATM) Implied Volatility for all of the stocks in the report.
Best,
Barry and The Blue Collar Investor Team
Premium Members,
The Weekly Report for 09/03/21 has been revised and uploaded to the Premium Member website. Some data was accidentally deleted but it has now been replaced. Look for the report dated 09/03/21-RevA.
Best,
Barry
Alan,
I am trying to understand why I should be using a Leap for the buy-side of the Poor man’s covered call and not say a 6-month option??
Thanks,
Robert
Robert,
We can use shorter-term options for the PMCC strategy which is technically a long call diagonal debit spread. However, traditionally, we use longer-term options to address one of the disadvantages of this strategy and that is the fact that options expire and stocks (our underlying for traditional covered call writing) do not… at least most stocks do not expire (remember Enron and others?).
As expiration of the options approaches, we will need to roll the options and that will result in a time-value cost-to-close as we sell the near-term option and purchase a further-out expiration. We can anticipate a time-value CTC of about $2.00 – $3.00 per-share. See pages 153 – 154 of our book “Covered Call Writing Alternative Strategies” and especially the chart on page 154.
So, the questions we ask ourselves is how often do we want to roll options and where is that additional cash coming from? There is no right or wrong here but these issues must be built into our strategy and addressed prior to entering any PMCC trades.
In the book, I favor LEAPs which are rolled 3 months prior to expiration and cash from a small percentage of LEAPS purchased not associated with short calls.
Take your time with this strategy… there are a lot of moving parts. It’s a lot more than “covered call writing, but cheaper”
Alan
Hi Alan,
I purchased INDA ETF for $46.57 on Aug 26th and then sold with a Strike price of $48.50 for 1% premium for Sept 10th.
The Stock is now $49.70 so the option will be taken unless I do something before Friday.
The $49.50 roll up is 0.5% – If I did this and the Stock is above that price do I:
Pay the 0.5% and the difference in Stock price from when I purchased to the new price Friday afternoon?
I am also thinking do I just allow the Stock to go as I have made the 1% plus I will receive the difference between what I paid and what it closes at. Currently that’s around $3 more per share.
Meaning I have made around 7.5% in two weeks.
I understand you cant give me financial advice, I was more checking that my math and theories were correct in my options
Regards,
Todd
Todd,
Very nice trade so far.
If INDA remains above the $48.50 strike and assignment is allowed, there will be a 5.1% 2-week return (use the multiple tab of the BCI calculators).
Rolling out-and-up to the $50..0 strike will result in an initial 2-week time-value return of 0.62% (16.1% annualized) and 1.24% with upside potential (32.2% annualized). See the screenshot below.
If INDA is still considered an eligible security and the initial time-value returns meets our stated goal range, rolling out-and-up makes sense. My preference is to wait closer to expiration Friday before making rolling-out decisions.
CLICK ON IMAGE TO ENLARGE & USE THE BACK ARROW TO RETURN TO BLOG.
Alan
Alan:
I very much appreciated your most recent session on “2 New Strategies”
I found the program to be both interesting & instructive.
I do have a question about what advantage or reason there might be to using VOLQ as a proxy to assess the Implied Volatility (IV) of QQQ as opposed to directly using the actual IV of QQQ?
Regards,
Paul
Paul,
You can use standard IV but I give the slight edge to VOLQ as it relates to QQQ only. The reason is that VOLQ is calculated (specifically for the Nasdaq 100) based on near-the-money strikes only. Standard IV stats include much deeper ITM and OTM strikes.
The difference does not appear to be huge but since VOLQ is available and intuitively appears to have a slight edge, that is the stat I use for QQQ.
Alan
Greetings Alan,
I hope all is well.
1)Will you be developing a VOLQ calculator to analyze target premium, expected price range for QQQ, etc for Weekly and Monthly options as per your presentation for premium members?
2)Also, during the presentation, you noted that that 7.21 is the divisor if using weekly options. What would the divisor be if one wanted to calculate the expected range of QQQ using VOLQ daily or just for the day?
Best,
Robert
Robert,
Yes, we have developed a BCI Expected Price Movement Calculator based on VOLQ or implied volatility.
The calculator is free to premium members and located in the “resources/downloads” section of the member site (right side). Scroll down to “E”
Just enter the price, IV or VOLQ and dates and the range will appear. The calculator will also show the following formula which can be used for all time-frames including 1-day:
Formula:
Approx. Expected (+/-1 Standard Deviation) Price Move =
($Stock Price)*(ATM IV)*[√((# Calendar Days to expiration)/365)]
Note: √ is symbol for the “Square Root”
For example, if VOLQ is 20, the 1-day calculation would be 20 x 0.052 = 1.04%
Alan
No price increase for premium members:
On November 1, 2021, BCI will be raising membership rates for new members only. This will not apply to current members. It’s been 4 years since we had a rate increase. In that period, we have added dozens of training videos, additional downloads and resources and more quality data to our stock and ETF reports.
We are fortunate to have such a robust and expanding membership and strive to provide the best high-quality information and tools at the lowest industry prices.
This price increase will not apply to current active members as you are grandfathered into the current rate for life or as long as your membership remains active. This is our way of showing our appreciation to our long-term members.
The increase for new members will go into effect on November 1, 2021 as follows:
Monthly: $19.95 for the first (trial) month and $57.95 each 30-days thereafter (currently $49.95).
Annual: $657.40 for the first 13 months (includes a reduced first month and a free last month) and then $695.40 every 13 months thereafter (includes 1 free month). Currently $569.40 and $599.40.
All new members who subscribe between now and 10/31/2021 will be grandfathered into the current rate and will see no price increase on 11/1/2021.
Thanks to all our loyal members for your support over the past 14 years and for putting on the financial map.
Wishing you much success,
Alan, Barry and the BCI Team
Premium members:
This week’s 4-page report of top-performing ETFs and analysis of the top-performing Select Sector SPDRs has been uploaded to your premium site. One and three-month analysis are included in the report. Weekly performance has also been incorporated into the report although not part of the screening process. Weekly option availability and implied volatility stats are also incorporated.
The mid-week market tone is located on page 1 of the report.
New members check out our ongoing and never-ending training videos (“Ask Alan” and Blue Hour webinars). We add at least one new video each month. Only premium members have access to the entire library of these training tools.
For your convenience, here is the link to login to the premium site:
https://www.thebluecollarinvestor.com/member/login.php
NOT A PREMIUM MEMBER? Check out this link:
https://www.thebluecollarinvestor.com/membership.shtml
Alan and the BCI team
Alan,
Regarding your Blog post on Aug. 28 where you had a CC on XLE at 49.50 and then traded a BTC at 10% limit threshold at a cost of $.03 per share. In the last few hours of the option, you then rolled down OTM to 48.50 at 0.14 income per share for a net total income of $0.11 per share.
Assuming your reference basis is 49.50 per share, the $0.11 additional income from the two trades is 0.11/49.50 or 0.22% additional gain. I am assuming the $0.11 per share was a near the money OTM covered call, and the next OTM strike option was not worth much.
If by expiration the underlying for some reason did rise above $48.50 option, your share would be assigned and you lose $1.00 or 1/49.50 = 2.0% from you original trade.
I realize that since the 10% threshold was reached the underlying is already 3% to 5% (or greater) down from our original purchase price. So the net position is at a loss if one just unwound the trade (after expiration) if the share were not assigned and you wanted out.
Case 1: Since this was favorable stock to begin with, and looking at the stats and market you feel the stock would recover, is it worth the risk to roll down for the additional income of 0.22% and lose the underlying?
Case 2: If however you have already decided this is an underlying you were not interested in keeping after expiration, you have reduced you losses by 0.22% and the rolled down covered call at $48.50 is justified.
Can you comment?
Regards,
Mario G.
Question: Is it worth risking the 2%
Mario,
My preference is to take advantage of exit strategy opportunities whenever they present themselves and they can enhance portfolio value. In the case of rolling-down to an OTM strike with XLE, I was able to generate an additional $44.00 with 3 hours remaining until contract expiration. Certainly, not a windfall, but cash in my pocket nonetheless.
Before I get to the 2 cases, I want to point out that in the 2% loss scenario, XLE, a declining stock, would have to turn around in the last few hours of the trading day and move up by $1.00 plus the distance between current market value and the $48.50 OTM strike. Possible? Yes. Likely? No.
Case 1: When our 10% BTC thresholds are reached, we are typically dealing with a stock that is under-performing. We are focusing in on generating as much cash as possible prior to contract expiration. If assigned, we can always buy the stock back on Monday if it meets our system criteria. Usually, that will not be the case, but it’s possible. 0.22% is a small number for sure. On the other hand, it’s a 3-hour return, 160% annualized. It takes under 4 minutes to execute… $44.00 for 4 minutes? I say yes.
Case 2: I like to roll-down to an OTM strike, when the premium justifies the trade. If I want to remove this security from my portfolio for the next contract, it will either be assigned or sold on Monday.
Thanks for your excellent questions. Thinking these trades through is what makes us better investors.
Alan
Hello Alan,
May I know how I can automate the 20%/10% guidelines (using Interactive Brokers)?
What are the settings I should take note of?
Regards
Dennis
Dennis,
Broker trade execution forms will vary in appearance but have the same basic information. After entering a covered call trade, we place a buy-to-close (BTC) limit order at 20% or 10% of the original option premium sold depending on the time to expiration (that info is detailed in my books and online video courses).
The screenshot below shows how to enter these limit orders. Note the following:
Click on the ticker symbol of the option just sold (top left)
Order type: Limit order
$: Enter 20% or 10% value
Action: Buy-to-close
Quantity: Enter the same number of contracts sold
Timing: Good until cancelled
You will then be asked to review and submit the trade.
CLICK ON IMAGE TO ENLARGE & USE THE BACK ARROW TO RETURN TO BLOG.
Alan
Hello Alan,
Thanks.
BTW, you mentioned 20% for the first half of the period (first 2 weeks for Monthly Options) and 10% for 2nd half of the period (later 2 weeks for Monthly Options). Do you do the same for Weekly? First Half of the Week and Second Half of the Week?
Also, can you automate the first and second half? Do you need to manually change to 10% in the 2nd half of the period?
Thanks.
Regards
Dennis
Dennis,
A Weekly option is the same as the last week of a Monthly contract. Use the 10% guideline.
When using Monthlys, set the 20% BTC limit order. The weekend prior to the last 2 weeks of the contract, we manually change that to 10%. I make a note on my calendar at the start of Monthly contracts.
See the screenshot below that reflects such a change in trade status.
CLICK ON IMAGE TO ENLARGE & USE THE BACK ARROW TO RETURN TO BLOG.
Alan