The CEO Strategy (Combining Exchange-traded funds with stock Options) is a covered call writing-like strategy where the only underlying securities considered are the 11 Select Sector SPDRs. These are ETFs that divide the S&P 500 into 11 different sector funds. In this article, I will highlight a real-life example detailing how to craft such a portfolio with weekly options for a series of 5-day trades, using a cash reserve of $100k.
CEO Portfolio Setup Spreadsheet: Data Entry
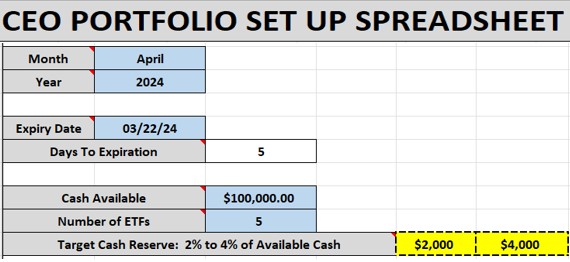
- The March monthly contracts expired, and the April contracts begin on March 18, 2024
- The weekly contract expires on 3/22/2024
- We are using $100k and the top 5 performing Select Sector SPDRs
- The spreadsheet shows a guideline cash-reserve of $2k – $4k (yellow cells) for potential exit strategy executions
Portfolio Initial Setup Spreadsheet
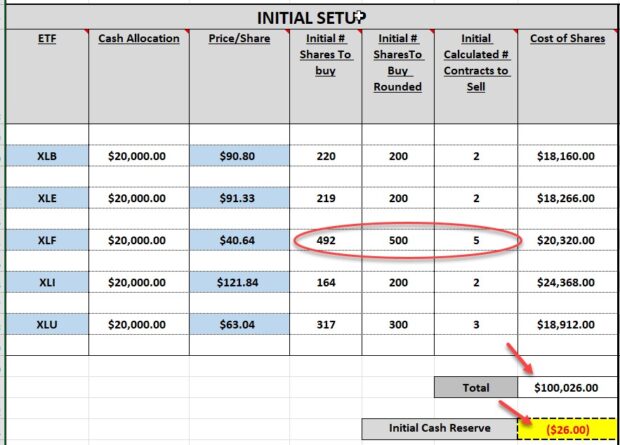
- After entering the top-performing Select Sector SPDRs and the prices-per-share, the spreadsheet calculates a cost of $100,026.00, a shortfall of $26.00 (yellow cell)
- There is no cash reserve aligning with the $2 – $4k guideline
- An adjustment of 1 of the positions is necessary
- I decided to reduce the XLF holding from 500 shares to 400 shares for the final portfolio setup (circled in red)
Portfolio Final Setup Spreadsheet
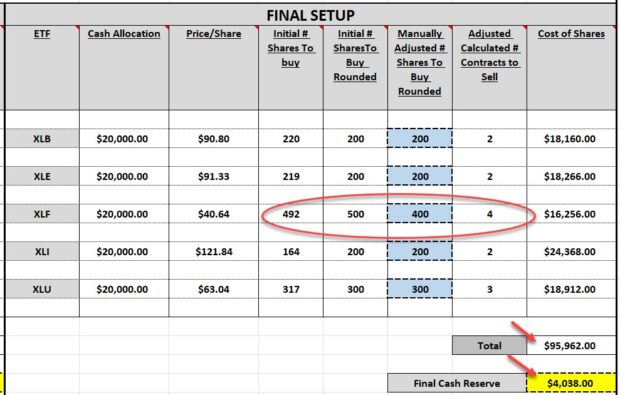
- 500 shares of XLF were reduced to 400 shares (red circled area)
- The new portfolio cost is $95,962.00 (top red arrow)
- The cash reserve for potential exit strategy executions is $4,038.00 (yellow cell)
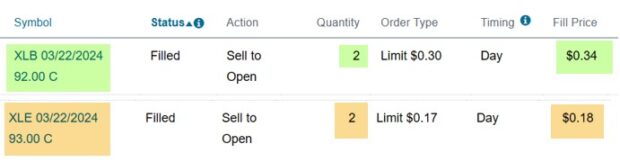
Broker screenshot of 2 of the option trade executions, after share purchase
Initial weekly calculations for these 5-day CEO covered call trades
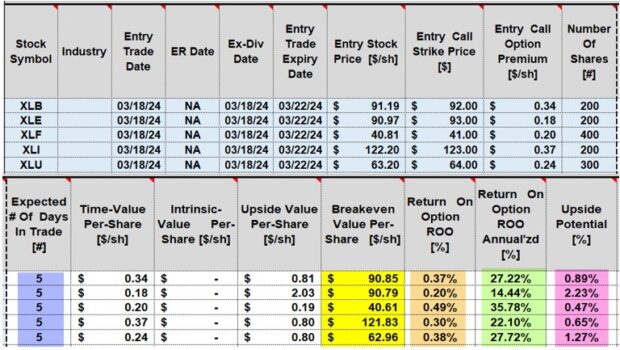
- Blue cells: The spreadsheet calculates a series of 5-day trades, if taken through contract expiration
- Yellow cells: Calculations of 5 breakeven price points (price-per-share – total premium)
- Brown cells: Initial 5-day time-value returns (ranging from 0.20% – 0.38%)
- Green cells: Annualized initial time-value returns based on 5-day trades (ranging from 14.44% – 35.78%)
- Pink cells: Upside potential if share price moves from current market value to the out-of-the-money call strike. This represents additional income stream potential for each trade, over and above premium returns (ranges from 0.47% – 2.23%)
Discussion
A streamlined approach to covered call writing, using the CEO Strategy, can be accomplished by selecting the top-performing Select Sector SPDRs, using the CEO Portfolio setup Spreadsheets and the BCI Trade Management Calculator (TMC).
Typically, annualized returns will range from 15% – 35%, with additional income potential from share appreciation.
Click here for 3 CEO Package choices.
Click here for CEO spreadsheets only.
The Complete Encyclopedia for Covered Call Writing- Classic Edition
(Amazon.com best-seller)

Over 500 pages packed with solid information, no useless filler material
151 charts and graphs most of which are in color for better visualization
Chapter outlines to summarize the material located in each chapter
4 flow charts that summarizes the stock selection and exit strategy processes
Questions and answers at the conclusion of each chapter to highlight the key points
14 appendixes to supplement the information found in the 20 chapters
Click here for more information.
On September 1, 2024, BCI will be raising membership rates for new members only. This will not apply to current members. It has been 3 years since we had a rate increase. In that period, we have added dozens of training videos, additional downloads and resources and more quality data to our stock and ETF reports. We are fortunate to have such a robust and expanding membership and strive to provide the best high-quality information and tools at the lowest industry prices.
LAST CHANCE: Premium Membership Price Increase Notification: No Rate Increase for Current Members
This price increase will not apply to current active members as you are grandfathered into the current rate for life or as long as your membership remains active. This is our loyalty pledge to you.
The increase for new members will go into effect on September 1, 2024, as follows:
Monthly: $19.95 for the first (trial) month and $69.00 each 30-days thereafter (currently $57.95).
Annual: $778.95 for the first 13 months (includes a reduced first month and a free last month) and then $828.00 every 13 months thereafter (includes 1 free month). Currently $657.40 and $695.40.
All new members who subscribe between now and 8/31/2024 will be grandfathered into the current rate and will see no price increase on 9/1/2021.
Thanks to all our loyal members for your support over the past 17 years and for putting BCI on the financial map.
Click here for member benefits video.
Click here for membership information.
Your generous testimonials
Over the years, the BCI community has been incredibly gracious by sending our BCI team email testimonials sharing stories as to what our educational content has meant to their families. Moving forward, we have decided to publish several of these testimonials in our blog articles. We will never use a last name unless given permission:
Alan,
I have already practiced for the majority of the year. I calculated each month’s return and last year’s paper-traded return calculated to an unbelievable 29.57%.
So, yeah, with returns that high, I actually can’t wait to try CCs in real-time.
Adrian
Upcoming events
1. Mad Hedge Investor Summit
Tuesday September 17, 2024
11 AM ET – 12 PM ET
Zoom webinar.
Portfolio Overwriting: Covered Call Writing Our Buy-And-Hold Stocks
Increasing profits and avoiding tax issues
Our buy-and-hold portfolios in non-sheltered accounts are generating 8% – 10% per year. Can we potentially increase these yields by selling stock options while, at the same time, dramatically decreasing the probability of our shares being sold to avoid potential tax implications? The answer is a resounding “yes”.
Portfolio Overwriting is a strategy that can benefit millions of investors seeking to enhance portfolio returns using a low-risk covered call writing-like strategy.
Traditional covered call writing will also be discussed to demonstrate comparisons between the 2 strategy approaches.
Topics discussed
Summary
Brief review of covered call writing
Option basics
What is an option-chain?
Option selection
Calculating covered call returns: Real-Life examples
Portfolio overwriting defined
Basics of strike selection
Pros and cons of portfolio overwriting
Why early exercise is so rare
Rolling options
Role of dividends
Locating ex-dividend dates
How to avoid early exercise
Avoiding earnings reports
Practical applications: Delta, implied volatility, annualized returns
Real-life examples with calculations
BCI Trade Management Calculator
2. Stock Traders Expo- live event in Orlando Florida
October 17 -20
- 2-hour Covered Call Writing Masters Class
- All Stars of Options class on Portfolio Overwriting
Details to follow.
3. American Association of Individual Investors/ Los Angeles Chapter
November 9, 2024
12 PM ET – 1:30 PM ET
Private webinar for members of this AAII investment club
4. Young Investors Club: University of Central Florida
Wednesday November 13, 2024
Private investment club
5. BCI-Only Webinar
Zoom
Thursday November 21, 2024
8 PM ET – (:30 PM ET
Covered Call Writing Dividend Stocks
Details & registration link to follow.
6. Long Island Stock Investor Group Part I
Zoom
February 13, 2025
7:30 – 9:00 ET
Details to follow.
7. Las Vegas Money Show
February 17 – 19, 2025
details to follow.
8. Long Island Stock Investor group Part II
March 13, 2025
7:30 – 9:00 ET
Details to follow.


Alan,
Can we use delta when writing deep in the money covered calls to establish a low end of the trading range? I know it can be done using implied volatility I saw in one of you videos.
Thanks,
Bruce
Bruce,
Yes. When we write deep ITM covered calls, we have 2 goals in mind:
1. Craft a trade that aligns with our personal risk tolerance (what is our approximate % risk factor?).
2. Make sure the associated low-risk ITM strike, delivers the initial time-value return goal range that aligns with our pre-stated target.
Let’s set up a hypothetical example.
We like is trading at $50.00 and we want to establish an ultra-low-risk approach to covered call writing with an initial annualized return goal range between 4% and 10%.
Let’s also assume we are willing to incur an approximate risk factor (of share price falling below the deep ITM call strike) of 15%.
Next, we check an option chain and look for a strike with a Delta of 85. This means that there is a 15% chance that the share price will fall below that deep ITM call strike, which we want to avoid.
We, then, check if the bid price of that 15-Delta strike aligns with our initial time-value return goal range.
Back to our hypothetical $50.00 stock:
If the option chain shows a 15 Delta for the $45.00 call which has a bid price of $5.30, we use the BCI spreadsheets to calculate an annualized initial time value return of 8%.
This would be a trade that aligns with our 2 goals.
Bottom line: We can use Delta to establish an ultra -low-risk covered call trade using deep ITM strikes.
Alan,
So I completed my first buy/write this week and have a question on the process. I purchased 400 shares of OII at $25.94 and sold the 9/20/24 calls at $1.62.
Since I sold the calls they are now in a loss position of -$301.00. While the stock is at a $448 gain.
Any cause for concern for the loss position? I suspect based on the share appreciation that is to be expected.
Holding the calls to expiration they will expire worthless, and the stock may or may not get called so no reason for alarm on the current loss position – is my thinking correct on that?
Personally, I don’t care if the stock gets called. Just interested if my thinking is correct?
Thank you,
David
David,
You are NOT losing money on the option side.
The -$301.00 you are seeing on your broker statement is the accounting protocol brokers use for short positions. When we sell covered call, we are “short” the calls. This means we sold the call options, and that trade is still open. This means that we will lose $301.00 if we buy back the options today.
When share price increases (OII is up $0.91 since you entered the trade), option value goes up according to its Delta, so it will cost more to buy back the option.
The $648.00 you generated when you sold the option is yours to keep no matter what the value of the option is today.
Bottom line: The negative sign is simply broker accounting protocol reflecting the fact that this is a short position. At this time, your trade is 100% successful.
Alan
Premium Members,
This week’s Weekly Stock Screen And Watch List has been uploaded to The Blue Collar Investor Premium Member site and is available for download in the “Reports” section. Look for the report dated 08/23/24.
Be sure to check out the latest BCI Training Videos and “Ask Alan” segments. You can view them on The Blue Collar YouTube Channel. For your convenience, the link to the BCI YouTube Channel is:
https://www.youtube.com/user/BlueCollarInvestor
Reminder: Premium Member’s pricing is locked into your current rate and you will never see a rate increase as long as the membership remains active.
Barry and The Blue Collar Investor Team
Premium members:
This week’s 4-page report of top-performing ETFs, along with our sample trade of the week, has been uploaded to your premium site. The Select Sector SPDR section is now crafted to align with our streamlined (CEO) approach to covered call writing. The report also lists Top-performing ETFs with Weekly options, mid-week market tone as well as the implied volatility of all eligible candidates.
We have also included a sample trade taken from one of our BCI watchlists.
Premium member video link:
https://youtu.be/EXMO-KwZuJs
For your convenience, here is the link to login to the premium site:
https://www.thebluecollarinvestor.com/member/login.php
NOT A PREMIUM MEMBER? Check out this link:
https://www.thebluecollarinvestor.com/membership.shtml
Alan and the BCI team
Alan,
Started paper trading last week on the list. I picked a basket of companies across several industries.
I did not pick NSSC because it had an earnings report yesterday; however, I wanted to track it to see what happened. Sure enough, after earnings, the stock took a significant move down. If I had been in the trade, it would have triggered both the BTC of the option and the stock sale.
The fundamentals of this company are strong, and it met earnings expectations but earned one cent less than the street was hoping for.
From your experience with similar situations, would a stock like this typically see a rebound after a few weeks, barring any other changes, or is selling the position the best option?
Joe
Joe,
Let me respond in general terms, not a specific recommendation for NSSC.
When a stock gets hammered as a result of a disappointing ER and is subsequently removed from our list of eligible securities, it must “earn” its way back onto our watch list before considering using it for our option trades.
Although rebounds are possible, they are not guaranteed, so sticking with elite-performers at the time we are executing the trades will benefit us in the long run.
Alan
Alan,
Thank you for getting back to me. While reading your response another question came to mind. For the BCI methodology, what’s the suggested best practice for dealing with a security which was on the list of eligible securities when the covered call trade was entered but falls off the list before the option expiration assuming that the 20% and 10% limits were not hit on the option.
My assumption was that It was best to stay in the trade as long as the limits weren’t triggered an the trade was profitable. Is this correct?
BR,
Joe
Joe,
You are correct.
Once we enter a trade using an eligible security from 1 of our watch lists, we do not close the based on its removal from these lists.
Instead, we manage the trade based on our exit strategy arsenal, including the 20%/10% guidelines.
If we decide to close the trade in its entirety and we want to choose a replacement stock, we use the most recent BCI Reports.
Alan
Hi Alan,
Couple questions –
I’m in the middle of reading your ‘encyclopedia’ book, and greatly
enjoying it. The chapter on portfolio management, really caught my interest.
I am retired with the majority of my portfolio in bonds, structured
notes and other non-volatile investments. I have a little room in my portfolio for equity exposure, but here is my question. I really am in this (writing covered calls) for exclusively the premium income. Not necessarily the high premiums but the right premiums.
What is wrong with writing deep ITM covered calls, with no expectation of share appreciation month after month, cycle after cycle? I don’t care if the stock gets called or not. As long as the math pencils in the Ellman Calculator, why can I write these just for the ITM premium income? What am I missing?
Is this logic flawed relative to your methodology or system?
Also, I am a bit confused between the DCCC and the TMC. In the DCCC we had to update prices daily to, but in the TMC it appears we don’t need to. Why the difference?
I see the 20%/10% calculations are already completed, is that is what is causing the difference?
Thanks,
Dave
Dave,
1. DCCC vs. TMC spreadsheets: There is no other spreadsheet like the TMC. It does it all. You can use the TMC for all covered call and put-selling trades and put the DCCC to sleep.
2. There is nothing wrong with selling deep ITM covered calls as a regular strategy approach as long as we understand the pros & cons of this trading style:
PROS: We are protecting our time-value returns with the intrinsic-value component of these ITM strikes. Our breakeven price points are lower than using ATM or OTM strikes.
CONS: We are eliminating the possibility of a 2nd income stream in the form of share appreciation to OTM strikes. Also, we are susceptible to option exercise and sale of our shares, which you stated you are okay with this.
Alan
Hi Alan,
For CEO strategy with weekly options – can you comment on exit strategies. When should we look for double and when should we roll down? Should we still go with 80 % & 90% guidelines to buy back and look for double or roll down?
Thanks
Kaylan,
Yes, the 20%/10% guidelines are always in place. If and when these thresholds are reached, triggering closing of the short calls, we determine next steps (rolling-down; waiting to “hit a double”) based on the factors detailed in our exit strategy parameters (days to expiration etc.).
Alan