A collar trade is a covered call trade with a protective put. Jim recently wrote to me asking about the efficacy of also selling an out-of-the-money put to help pay for the cost of the protective put. This article will analyze this series of trades to assess the pros and cons of adding that fourth leg (short put) to our collar trades. We will use Nvidia Corp. (NASDAQ: NVDA) as a real-life example.
The stages of a collar trade + a short put (total of 4 legs)
- 10/9/2018: Buy 100 NVDA at 264.24 (now a long stock position)
- 10/9/2018: Sell 1 x $265.00 call at $14.45 (now a covered call trade)
- 10/9/2018: Buy 1 x $250.00 put at $8.20 (now a collar trade)
- 10/9/2018: Sell 1 x $245.00 put for $6.65 (covered call on the upside and a bear put spread on the bottom side)
Covered call trade- initial calculations
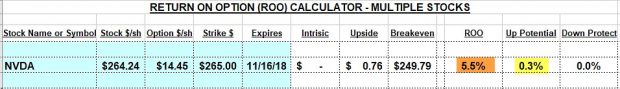
NVDA: Initial Covered Call Calculations
The Ellman Calculator (multiple tab) shows an initial time value return of 5.5% (brown cell)and a total potential 5-week return of 5.8% with upside potential (yellow cell).
Collar calculations adding a protective put

NVDA: Collar Calculations with the BCI Collar Calculator
- The red arrow highlights an initial time value return of 2.37%
- The purple arrow highlights a 2.65% return with upside potential to the call strike
- The green arrow points to a 3.02% maximum loss if share price drops to the put strike or lower
Adding a short put to help fund the cost of the long protective put: Advantage
By generating a premium of $6.65, the $8.20 cost of the protective put is reduced to $1.55. The initial calculations then become
$14.45 – $1.55 = $12.90 = 4.9% (cost basis of $264.24). This more than doubles the collar initial time value return.
Adding a short put to help fund the cost of the long protective put: Disadvantage
By selling the deeper out-of-the-money put ($245.00 strike),we are incurring additional risk to the downside. Once the price moves below the $245.00 strike, we start losing money on that leg of the trade as the strike now is in-the-money and has an intrinsic value component. That risk can be quantified in a worst-case-scenario as follows:
$245.00 – $6.65 = $238.35 per share
Of course, we would take exit strategy steps before letting the trade get that far out of control but the risk should be understood and quantified before entering the trade.
Discussion
When establishing our covered call positions, we must define our personal risk-tolerance and set up our trades accordingly. If we require additional protection to the downside, a protective put is a reasonable approach. Like most insurance policies, we must pay for this protection and our initial results will then decline. If a short put is added to mitigate the cost of the long put, we will then be adding additional risk which is what we were trying to avoid by buying the protective put.
For more information on collar trades:
For access to the BCI Collar Calculator:
April 5th stock report
Will be published late Sunday to early Monday as Barry recovers from his new bionic knee… can’t keep a good man down!
Quinnipiac G.A.M.E. Forum

Alan Speaking to College and Graduate School Finance Majors from the US and Abroad at the NY Hilton
Upcoming events
-May 8th
Alan will be hosting a free webinar for the Options Industry Council (OIC) on generating income from selling options. Click here to register for free.
-May 13th
All Stars of Options
Bally’s Hotel, Las Vegas
10 AM – 10:45 AM
How to Select the Best Options in Bull and Bear Markets
Free event
-May 14th
Las Vegas Money Show
Bally’s/ Paris Hotel
12:15 – 3:15
Master class encompassing covered call writing, put-selling and the stock repair strategy
This is a paid event hosted by The Money Show
Your generous testimonials
Over the years, the BCI community has been incredibly gracious by sending our BCI team email testimonials sharing stories as to what our educational content has meant to their families. Moving forward, we have decided to share some of these testimonials in our blog articles. We will never use a last name unless given permission:
Alan,
My first month using BCI has been awesome. I have already generated $2300 in selling calls and $1600 in stock appreciation. I am trading with $53,000 so returns are amazing. I’ve been trading for 15 years and your methodology is by far the best I’ve seen.
Mark C.
Market tone (***starting in April, market tone information will be located on page 1 of premium member stock reports)
This week’s economic news of importance:
- Chicago Fed national activity index Feb. -0.29 (-0.25 last)
- Housing starts Feb. 1.162 million (1.201 million expected)
- Building permits Feb. 1.296 million (1.317 million last)
- Case-Shiller home price index Jan. 4.3% (4.6% last)
- Consumer confidence index March 124.1 (133.0 expected)
- Trade deficit Jan. -$51.1 billion (-$57.7 billion)
- Weekly jobless claims 3/23 211,000 (222,000 expected)
- GDP revision Q4 2.2% (as expected)
- Pending home sales Feb. -1.0% (4.3% last)
- Personal income Feb 0.2% (0.3% expected)
- Consumer spending Jan. 0.1% (0.3% expected)
- Core inflation Jan. 0.1% (0.2% expected)
- Chicago PMI March 58.7 (64.7 last)
- New home sales Feb. 667,000 (625,000 expected)
- Consumer sentiment index March 98.4 (97.8 expected)
THE WEEK AHEAD
Mon April 1st
- Retail sales Feb.
- Markit manufacturing PMI March
- ISM manufacturing index March
- Construction spending Feb.
- Business inventories Feb.
Tue April 2nd
- Durable goods orders Feb.
Wed April 3rd
- ADP employment March
- Markit services PMI March
- ISM nonmanufacturing index March
Thu April 4th
- Weekly jobless claims 3/30
Fri April 5th
- Nonfarm payrolls March
- Unemployment rate March
- Average hourly earnings March
- Consumer credit Feb.
For the week, the S&P 500 moved down by 0.77% for a year-to-date return of 11.72%
Summary
IBD: Uptrend under pressure
GMI: 5/6- Bullish signal since market close of January 31, 2019 as of Friday AM
BCI: I am favoring out-of-the-money strikes 3-to-2 compared to in-the-money strikes for new positions
WHAT THE BROAD MARKET INDICATORS (S&P 500 AND VIX) ARE TELLING US
The 6-month charts point to a slightly bearish market tone. In the past six months, the S&P 500 moved down 3% while the VIX (13.71) moved up by 14%.
Wishing you the best in investing,
Alan and the BCI team
Premium Members,
This week’s Weekly Stock Screen And Watch List has been uploaded to The Blue Collar Investor premium member site and is available for download in the “Reports” section. Look for the report dated 03/29/19.
Also, be sure to check out the latest BCI Training Videos and “Ask Alan” segments. You can view them at The Blue Collar YouTube Channel. For your convenience, the link to the BCI YouTube Channel is:
http://www.youtube.com/user/BlueCollarInvestor
The report for next week, 04/05/19, will be published late Sunday to early Monday. I’m getting a new shiny knee. The surgery is scheduled for Friday 04/05/19…so I won’t be getting the report out in the usual time frame.
Best,
Barry and The Blue Collar Investor Team
barry@thebluecollarinvestor.com
Alan,
I’m curious about how others in the BCI community are forming their portfolios each month. I’m noticing there are frequently a lot software companies on the list that I have been using. As a result, my portfolio has ended up weighted towards software, which I know is going against the BCI recommendation.
I’m also interested how portfolio size might affect the selection of stocks and ETFs.
Thanks, Scott
Scott,
The BCI guidelines regarding portfolio construction is that no one stock or industry should represent more than 20% of our portfolio which should consist of at least 5 different stocks and industries. When using ETFs we can use less than 5 securities because an ETF represents a basket of stocks with diversification within that one security.
Although there is a representation of software companies in our current stock report which was published late last night, there are 12 other industry segments also on the list so proper diversification should be achievable. The ETF Report can also be used.
The larger the portfolio size (cash available), the more securities we can have to achieve greater diversification. Here are general guidelines:
Under $35k: Use ETFs
$35k – $50K: Use 5 stocks
$50k – $100k: Use 5 – 10 stocks
$100k – $300k: Use 10 – 15 stocks
> $300k: Use 15 – 25 stocks within your management comfort level
These are guidelines to consider but the concept of proper diversification must be adhered to.
Alan
Hi Scott,
there are many members, and you can be sure each one has a different approach, so my personal view is just a sample.
First I am a true beleiver in the BCI methodology.
Second, I do not have much time for homework.
3rd, I trade exclusively in buy/write monthly CCs of American companies.
So, after expiry weekend, I look at the bold tickers in the fresh run list, and check Yahoo finance chart and other details.
If I find a good candidate, I double check in my Schwab “market Edge” second opinion tech info (buy,hold, avoid, etc.)
I also double check at Earnings Whispers for ER date and hour.
I never have more than 2 positions in the same industry.
Also, I subscribe CML ($10.00 a month) for their “top picks”, and select some of my tickers from them.
Good luck – Roni
Alan,
When selecting stocks from Premium report, does the number of weeks on the run list plays important role when choosing underlying? For example EW and REGN are both Medical stocks, but EW is 9 weeks on the run list and REGN is only 1 week, so I assume EW has stronger uptrend that we can expect to continue.
When choosing stocks for your trades do you consider how long stock have been on the run list?
Sunny
Sunny,
I view this column in our member reports as a secondary parameter or a tie-breaker, if you will. These 2 stocks are so close that this factor actually will come into play.
Both stocks have passed our rigorous screening process and are eligible for option-selling (calls or puts). Now, they have similar industry rankings of “A”, similar analyst ratings, betas and both have mixed, but acceptable technical indicators. Also, both have no earnings report conflicts for the April contracts.
So what may distinguish the two? Well, REGN costs twice as much as EW so that may be a factor for some. The On balance volume is steady for EW but trending down for REGN and finally, EW has been on our list for 9 weeks compared to one week for REGN.
Both are solid candidates for option-selling but I’d give the slight edge to EW if choosing between these 2 securities.
Good question…a possible blog article.
Alan
Alan,
Thank you for providing such good information to the trading community. I am new to options indeed trading and looking to invest some funds during my retirement. I have purchased some of your books and I am reading the exit strategy’s at the moment. I am getting the message loud and clear, well I may have to read it a couple of times.
I do have a few questions if I may?
1. You mention in the book and on video 7 that if the stock is higher than the strike price then you can role up and out. Q would you not be assigned as soon as the stock price surpasses the strike price? Or is it the case that the option is yours until the the expiration Friday?
2. On another matter, it would appear that you almost want a good underlying stock to go down a little to do the double down method, although then you would be loosing on the underlying?
3. I’m living in the Uk so cannot make use of you IRAs etc, however, we do have the facilities that we can trade US Stocks in a tax free environment which is called spread betting. What options strategy could I use to hedge against a loss. The stocks available are mainly the Dow 30 and the S&P 500?
This would be in addition to your core strategies which I will be trading with a US account with Charles Swab
Best regards
John
Keep up the great work
John,
Welcome to our BCI community.
My responses:
1. Exercise will almost always occur after (not during) contract expiration if the strike is in-the-money. A possible exception relates to dividend distributions. The 2 main reasons exercise will not occur early are: Option buyers do not want to be share owners but rather option sellers and option buyers make more money selling the option rather than exercising the option and selling the shares.
2. We want the “best of the best” for our underlyings and screen for stocks more likely to increase in value. This will benefit us especially when selling out-of-the-money calls. We do want to take advantage of our “hitting a double” exit strategy when stock price declines but this is a reaction to mitigating when a trade turns against us rather than selecting stocks likely to decline in value.
3. I am not an expert on tax issues in the UK but we do provide reports to our members on Dow 30 (Blue Chip Rep[ort) and S&P 500 stocks (SelectSector SPDRs). For the former, look for stocks that have outperformed the S&P 500 in both 3-month and 1-year time frames and for the latter, look for the top-performing SelectSector SPDRs in the past 3-months and re-evaluate weekly.
Let us know how you’re progressing.
Alan
Alan
On the Single tab and other tabs, how do I calculate the Price / Share column?
Thank you.
Mike
Mike,
The price/share cell reflects the price of the underlying stock or ETF at the time the trade was entered. If a stock is purchased at $30.00 and then the option is immediately sold, enter $30.00. If the stock was purchased a year ago at $22.00 and was $30.00 at the time the option is sold, enter $30.00.
Alan
Alan,
If the underlying stock moved significantly higher, say 30%, and the option has also moved very much in the money (almost 98 delta now), theoretically, shouldn’t I be able to recover some of that upside when I renew the option contract?
For example, I was able to do that comfortably at expiration day for one other position where I recovered almost 40% of the upside in a new 3 week option contract, but it seems I am not able to do that for another stock (I am two months away from expiration but very much in the money like mentioned above).
What factors come into play for this scenario where it seems I will not be able to recover the upside by attempting to rolling up and forward?
Thank you very much!
Mazin
Mazin,
Let’s first focus in on how our covered call trades are set up:
We purchase the stock and then sell an option that meets our initial time value return goal…let’s say 2.5% per month. If we sold an out-of-the-money call, we have an upside potential stock return, let’s say 3%. This means our maximum, 1-month trade return is 5.5% and we are comfortable having our shares sold at the option strike. This is our thinking as we enter our trade. We understand that, in return for getting paid to undertake the contract obligation, we are capping the upside…this is the definition of covered call writing.
Now, let’s say share price rises substantially leaving the strike deep in-the-money with Delta approaching 100. How should we view this scenario? Well, it appears we have accomplished a maximum return on our trade…option premium + share appreciation to the strike. This is a positive! The strategy we do look to is the “mid-contract unwind” exit strategy where the original position is closed (mid-contract) and a new position is established with a different stock in the same contract month to generate a second income stream with the same cash originally invested.
The cost-to-close the short call consists of time value + intrinsic value. As the strike moves deeper in-the-money, the cost will be almost all intrinsic value with a small time value component so capturing upside beyond the strike is paid for in the form of intrinsic value.
Trades that you describe in your question are best-case scenarios…maximum returns. The only exception is when we sell options on stocks that were purchased at a much lower cost-basis in non-sheltered accounts that may represent tax issues. For this strategy, see the portfolio overwriting information in my books and DVDs.
Congratulations on these trades.
Alan
Alan,
I recently read your Encyclopedia and have been virtually trading covered calls for awhile based on your strategy and doing quite well.
However, the biggest problem I’m having is that by the time I’ve gone through the selection process of various covered call candidates (i.e., printing out option chains, running various strike prices for candidates thru your Calculator etc) when I go to buy the best candidates, the stock prices/option premiums have usually changed significantly, thereby significantly affecting the returns I was hoping for. I have tried a few different ways to address this, but can’t seem to optimize the selection process so the figures I’m using in my calculations are closest to what they will be when I go to execute the trade.
I’m sure you have figured out a method of addressing this. I’ve searched your blog and you said you only trade b/w 11am and 3pm to reduce volatility so I’m sure this is part of it. But, then do you also do all your calculations immediately before also in this time period for the few stocks you’ve identified the night before (or something like this?)
Can you please point me in the right direction?
Thanks,
John
John,
Using the “multiple tab” of the Ellman Calculator will allow us the get a sense of ROO (return on option), upside potential and downside protection if done at night or over the weekend. When markets open, prices may change but the percentiles will remain similar let’s say from Monday night to Tuesday. I would not wait days between calculations and trade entry because Theta (time value erosion) will negatively impact our returns.
That said, calculations, need to be done or re-done just prior to trade executions. This means that we must find a small time slot during trading hours to enter our trades after running the numbers from updated option chains. It won’t take that much time once we have decided on our underlying securities and the “moneyness” of our options.
I do prefer trading between 11 AM and 3 PM ET to avoid computerized institutional trading that increases market volatility.
Using these guidelines will result in a practical and time-efficient way to enter our trades.
Alan
Hi Alan,
Having discovered you on YouTube, I’m familiarizing myself with your techniques.
I recently reclaimed control over my money by closing out a managed brokerage account. One of the stocks had fallen precipitously and I wonder if there’s any way I can use covered calls to make back some of the lost money. I still own the stock.
Best,
Lynn
Lynn,
Welcome to our BCI community.
It’s the cash, not the stock, that is important to us. Let’s say we started with investing $1500.00 in stock XYZ and share value declined such that we now own $1000.00 worth of that same stock. The most relevant question, in my humble opinion, we should ask ourselves, is where we should trust that now $1000.00… in that same stock or a different one?
If we are still bullish on XYZ, we can sell out-of-the-money call options to both generate premium cash and still allow for share recovery up to the strike price. Avoiding earnings reports remains a critical rule in the BCI methodology.
One more point: Call options can be used to lower the cost-basis of our losing stock positions:
https://www.thebluecollarinvestor.com/stock-repair-strategy-using-stock-options-to-reduce-losses-when-stock-price-declines/
https://thebluecollarinvestor.com/minimembership/stock-repair-calculator/
Alan
Trading Experiences…. XBI and Recent Portfolio History
XBI Hit Double:
4/2/19: Just Hit a Double for this expiration period (Exp 4/18) at strike 93. A similar set of events happened March Expiration period.
Here are the trades for this month (prices after commission):
3/19/19: XBI at 87.98. Overwrite trade at STO of 1.85 Strike 93 (1.85 / 93 = 1.99%)
3/27: XBI at 87.09. 30% rule exit strategy (Did not use 20%) BTC at 0.51 Strike 93. (0.51 / 93 = (-0.55%)
4/2:: XBI at 91.85. Hit Double STO at 1.28 Strike 93 (1.28 /93 = 1.38%)
Net %Gain for the month = 2.82%
Check: (1.85 – .51 + 1.28)/93 = 2.82%
9/6/18: My original purchase on 9/6/18 was at a share price of 96.95 and Breakeven of 94.64 (strike 96). In the Money Return Cost Basis (RCB)= 96.
4/2/19: With the Hit Double trade and XBI at 91.85, my new Breakeven is now at 88.92. If the position gets exercised at strike 93, my overall position gain is (93 – 88.92) / 96 = 4.08 / 96 = 4.25%.
*****************************
Recent Market History Comments:
XBI is one of my positions I have held since the market sharp decline beginning Sept. 25, 2018. I actually was 92% invested in ETF’s in my 5 account portfolio since I had decided to try that strategy for a few expiration periods. No worry about ER dates!
As I have described here before, I generally diversify and place the same trades in all of the accounts I have..
At first i closed the options at the recommended 20% point when the market starting declining sharply. . The market and portfolio continued to drop. I am sure many BCI members were in a same predicament.
On 12/24/18, at the market lowest point, my portfolio Account value had declined 16% of the value on 9/6 (XBI had declined worse than that value).
I know BCI recommends cutting your losses at the 8-10% point. Many positions were there already or worse. At 2% per month it would take me up to 5 months to recover my portfolio. The market had shown no signs of recovery at that 8-10% level yet. The actual bottom came on 12/24. That’s almost a 4 month period.
I could have, at the end of the year, done some Tax Loss Harvesting or Tax-loss selling, offsetting the capital gains of my taxable accounts (3 accounts). But I felt the tax I would avoid paying would only partially compensate the larger net loss I would incur with that strategy. I would still have to to rely on the 2% per month goal income.
A comfortable feeling I had was that my two previous years I had a 24% and 16% portfolio gains, so i had a cushion there and could accept some losses “gracefully”. Someone else who did not had that history would not have that available. But I did.
I felt the market would recover a good portion of its value in the initial months of 2019 and that did become true for some positions. The fact I had past good performing ETFs and no ER to worry about helped..
Back to today:
Here we are 3 months later since the 12/24 recovery point and my portfolio is down 1.2% from the 9/6/2018 account value. That’s a 15% gain in 3 months. That includes income from some overwriting I was able to do without losing the underlying.
Mario
I forgot to attach this graphic I made of my 4/2/19 Hit Double with XBI. The same information is in the text of my first message.
Mario,
Great work and thanks for sharing. With your permission, I’ll be using this example in a future blog article.
Alan
Alan,
I’ll do better than that. I will send you the complete trades from 9/6/18 just before the market went south to a reversal on 12/24/18.
I would be interested in your opinion on how you would have handled the sharp down turn after doing your 20% BTC exit strategy? Did you unwind and close all your CC trades, or kept some of them for longer term recovery?
Thinking about it further, and also realizing while I was writing the blog article, I was probably unique with my set of trades since they were all ETFs, therefore ER dates was not an issue.
Another trader with Equities (not ETFs) would not have a choice of Exiting or keeping the investment for a long period because the strategy is to exit completely to avoid being invested on the ER date. Therefore time was of essence to exit in the 8-12% loss window..
Mario
Premium members:
This week’s 8-page report of top-performing ETFs and analysis of ALL Select Sector Components has been uploaded to your premium site. The report also lists Top-performing ETFs with Weekly options as well as the implied volatility of all eligible candidates.
New members check out the video user guide located above the recent reports.
For your convenience, here is the link to login to the premium site:
https://www.thebluecollarinvestor.com/member/login.php
NOT A PREMIUM MEMBER? Check out this link:
https://www.thebluecollarinvestor.com/membership.shtml
Alan and the BCI team
Buy put at a different expiration date will lower the cost of the put instead of the same expiration put.
For eg:
Choose short call at 55day expiration
and
Choose long put at 38day expiration
and improvise the trade if the trade needs adjustment.