Portfolio Overwriting is covered call writing using existing long-term buy-and-hold securities. It implies low cost-basis shares, dividend-bearing stocks and exchange-traded funds (ETFs). Since we don’t want our shares called away while generating additional option premium, cash flow decisions must be made on the best strike prices to select for our short calls. What is the basis of these selections? Some may turn to Delta. One of the commonly used definitions of Delta is the probability of the option strike expiring in-the-money. The deeper out-of-the-money the strike, the lower the Delta. So should we select a Delta of 10, 20, 30? One answer lies in our strategy goals.
Defining our goals
There are two goals inherent in portfolio overwriting:
- Increase portfolio returns by selling options
- Avoiding exercise of these options
We want to have our cake and eat it too!
Strike selection clarity can be achieved by first stating our annualized return goals. We may want to increase our long-term portfolio returns by 2%, 4%, 6% or 8% per year, as examples. Once the annualized goals are set, we then check option chains for out-of-the-money strikes that generate these targeted returns.
Real-life example with Facebook, Inc (NASDAQ: FB)
In March 2018, prior to its price decline based on security issues, FB was trading at $185.09. The option chain for the April contracts is shown in the screenshot below:

FB Option Chain
The brown field highlights 1-month expiration strike prices currently $10.00 – $20.00 higher than current market value. The bid prices are $1.31, $0.55 and $0.16 for the $195.00, $200.00 and $205.00 strikes respectively. Let’s next feed these stats into the BCI Portfolio Overwriting Calculator:
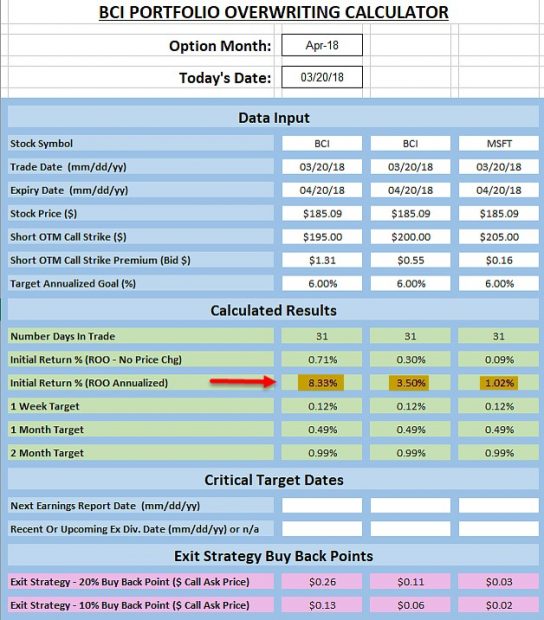
Portfolio Overwriting Calculations for FB
The three strikes showed annualized returns of 8.33%, 3.50% and 1.02% as highlighted in the brown fields. By setting annualized return goals before entering a trade, the calculator will guide us to the appropriate strike selection.
Discussion
Before entering a trade, we must first determine our return goals. Once these are established, strike selection is facilitated particularly when utilized calculators like the BCI Portfolio Overwriting Calculator.
Coming soon: Stock Repair Calculator
In the past few months, several of our members have inquired about the stock repair strategy where options are used to mitigate losses from stock price declines. This is not an income-generating strategy as are covered call writing and selling cash-secured puts. It is a strategy where we use our knowledge of options to lower our breakeven price point for stocks that we own at a higher price than current market value. I will be publishing a blog article to further explain the strategy and provide a detailed webinar on the premium member site. Barry and I have created a calculator that will assist in setting up and managing the 3 legs of these trades (long stock, long call and short calls). Here is a screenshot part of the spreadsheet:

Stock Repair Calculator
Upcoming event
AAII National Investor Conference: Las Vegas Nevada
October 26 @ 8:00 am – October 28 @ 1:00 pm
October 26th – 28th, 2018 (Friday through Sunday)
Alan’s presentations: Saturday October 27th at 9:30 AM and 1 PM (just added)
Visit Alan, Barry and the BCI team in the exhibit hall Friday, Saturday and Sunday
Market tone
This week’s economic news of importance:
- Case-Shiller home price index July 6.0% (6.2% last)
- Consumer confidence index September 138.4 (133.2 expected)
- New home sales August 629,000 (625,000 expected)
- FOMC projections 2-2.25% (as expected)
- Weekly jobless claims 9/22 214,000 (216,000 expected)
- GDP revisions Q2 4.2% (4.3% expected)
- Durable goods orders August 4.5% (2.2% expected)
- Pending home sales August -1.8% (-0.8% last)
- Personal income August 0.3% (0.4% expected)
- Consumer consumption August 0.3% (0.4% expected)
- Consumer sentiment September 100.1 (100.8 expected)
THE WEEK AHEAD
Mon October 1st
- Markit manufacturing PMI September
- ISM manufacturing index September
- Construction spending August
Tue October 2nd
- Motor vehicle sales September
Wed October 3rd
- ADP employment September
- Markit services PMI September
- ISM nonmanufacturing index September
Thu October 4th
- Weekly jobless claims 9/27
- Factory orders August
Fri October 5th
- Nonfarm payrolls September
- Unemployment rate September
- Average hourly earnings September
- Trade deficit August
- Consumer credit August
For the week, the S&P 500 moved down by 0.54% for a year-to-date return of 8.99%
Summary
IBD: Market in confirmed uptrend
GMI: 4/6- Bullish signal since market close of July 9, 2018
BCI: Selling an equal number of ITM and OTM strikes for new positions.
WHAT THE BROAD MARKET INDICATORS (S&P 500 AND VIX) ARE TELLING US
The 6-month charts point to a bullish tone. In the past six months, the S&P 500 was up 10% while the VIX (12.12) down by 40%.
Wishing you much success,
Alan and the BCI team
Hi Alan and all BCI Members
First of all thanks a lot Alan, your educational material and site is awesome.
I m a new BCI premium member and an enthusiastic reader of your Encyclopedia.
I m pretty new to covered calls so I’m looking for advice from Alan and much more experienced members.
This is my situation:
09/21 STO 2 ITM call on EW (Edwards Lifesciences) strike 150 expiration on 19/10 premium 5,89.
Now in few days stoke went to the sky as I m writing it is at 174.
What to do now with a deep ITM 150 call?
I considered the following options:
– to unwind it: the BTC is 26 $ considering the premium received (589) and the proceeds from sale of stock 17.400 I would have a net gain to unwind of 79
– to wait and see if the stoke stop to go to the sky and to unwind at a better price
– to wait end of contract and roll out at 150 generating some cash – I think there is too much time value in the option to roll out now
Any help and comment would be more than welcome.
Federico
Federico,
Congratulations on a successful trade to this point. When stock price rises substantially early in a contract, we focus in on the time value cost-to-close. When a $150.00 call is sold, our shares can be worth no more than that strike price as long as the call obligation is in place. If we buy back the short call, share value moves up to current market value. With the stock price currently at $174.10 and the “ask” cost-to-close price at $25.20, the time value cost-to-close is $1.10 ($25.20 – $24.10) after subtracting the intrinsic value of the premium. This represents (about) a 0.7% cost-to-close depending on the price paid for the shares (I guesstimated). I would consider closing if we can generate a 1.7% return or higher on a new position in the same contract month. Currently the cost-to-close is a bit too expensive but I’d keep a close eye on that cost especially if share price continues to appreciate.
This exit strategy is known as the “mid-contract unwind exit strategy” in our BCI community and detailed information can be found here:
Complete Encyclopedia- classic: Pages 264 – 271
Complete Encyclopedia Volume 2: 243 – 252
Keep up the good work.
Alan
hi Alan
very appreciated your answer, thanks a lot
Federico
Hi Federico,
every time this fortunate situation comes up, we feel an urge to do something about it.
But there is really nothing much we can do except feel good about the trade, because it seems very protected and highly probable to end up expiring within our planned gains.
One of the most difficult skills that we must acquire in this game is to avoid emotional decisions and greed.
Stay cool – Roni
Federico,
Alan’s right on that you would lose 0.7% in your ROO if you unwind now with an ASK price of 25.20 (UNWIND TAB of Elite Calculator)
You can get the same result as follows:
ASK 25.20 Intrinsic 24.10 TV= 1.10 1.10 / 150 = 0.733% (Recommend a new investment of 1.7%)
If you can get the midpoint of 24.60, then TV = .50 and you loss is only .50/150 or 0.33% (Recommend a new investment of 1.3% if close)
For a strike of 150, a .1% loss is 0.15 in Time Value.
What I do for all my trades if I see a Gap Up is to immediately set a goal of 0.1% and create an unwind OPEN GTC LIMIT ORDER to guarantee that. You can do that is you set a Credit Limit of STRIKE – Time Value or 150 – 0.15 = 149.85. (This equation is only true for an ITM call (NOT OTM), as I have explained in this blog several times).
Sometimes on market open or during the day the price of the stock will spike higher and your trade will fill at 0.1% loss. Nice to walk up to my computer and find the order has filled. You can adjust it to 0.2% or higher (Credit Limit 149.7) if you wish.
Good luck.
Mario
Premium Members,
This week’s Weekly Stock Screen And Watch List has been uploaded to The Blue Collar Investor Premium Member site and is available for download in the “Reports” section. Look for the report dated 09/28/18.
Also, be sure to check out the latest BCI Training Videos and “Ask Alan” segments. You can view them at The Blue Collar YouTube Channel. For your convenience, the link to the BCI YouTube Channel is:
http://www.youtube.com/user/BlueCollarInvestor
Best,
Barry and The BCI Team
barry@thebluecollarinvestor.com
Alan,
It has been a great first month, just a quick follow-up, then I won’t bother you (too) much any further.
I opened all on Sept 6 and just closed on Sept 28 all but one underlying, that I rolled. Most are for upcoming earnings. (I hope the table is readable).
Again, I put to work only 20% of my IRA. (I will not be looking for any new consulting gigs, anytime soon.)
I plan to redeploy on Monday and go until a week before the midterms elections.
I rolled (out & up) VEEV into the next cycle without noting any profit. Otherwise closing VEEV would have put me up over $4,000. (Note: This surpass all my monthly bills, that is my goal.)
Before I dust off my BCI encyclopedia, is this the correct way to calculate the profits, that being until they are realized? (seems that is the only sensible way)
Once again, thank you, and I will not be a pest.
CLICK ON IMAGE TO ENLARGE & USE THE BACK ARROW TO RETURN TO BLOG.
Jim
Jim,
I love it…nice going.
There are 2 types of calculations: initial and final. The Ellman Calculator is designed to calculate initial time value returns, upside potential, breakeven and downside protection. The Elite version of the Ellman Calculator (free to premium members in the “resources/downloads” section of the member site) has 7 additional tabs in the form of a Schedule D where long and short term capital gains or losses can be quantified both during the trade dates and annualized.
Now, for those who want to get an ongoing perspective of combined realized and unrealized results:
(Current value of portfolio – portfolio value at the beginning of the analyzed period)/portfolio value at the start of the analyzed period.
If, at the end of the September contracts, our portfolio was worth $70k and was worth $68 at the beginning of the September contracts:
($70k – $68k)/$68k = 2.9% return
Alan
Jim,
Congratulations on a fantastic first month! I have not been at this as long as Alan any many other friends here. But I would like to support and further emphasize two great things you wrote: selling options in your IRA and covering your spending.
I am retired trading options in my IRA is a main hobby. It pays the bills most months :). Now, I go a bit overboard, have level 3 clearance in my main IRA, day trade expiring SPX options M/W/F, swing trade debit and credit spreads and also portfolio overwrite/sell CSP’s to either build/start investing positions or just take the eventual income.
But fellow retirees don’t need to be options junkies like me :)!
With a reasonable retirement portfolio it is possible to plan how much you spend on average in a month then target option selling strategies to generate a little more than that in cash flow.
I say cash flow because you won’t know if it is truly income until you manage positions, see what impact losers have on your gains and how much you needed to spend to buy back winners versus what you get rolling them. So keeping a monthly P/L is helpful in my view.
I have a monthly cash flow target for options sales. That frees me up more to do other things with more speculative strategies if desired. Or just leave things uncovered for possible appreciation.You may find you cover your lower Beta holdings for core cash flow then let higher beta things run – or the reverse! You can also flex strikes ITM. ATM and OTM and feel like you are managing your assets like the business it is. – Jay
Trading Experiences 9/28
Here is my analysis on last weeks run list after 1 week.
Run List 9/21, End of Week 1:
Positive equities: Total 5, Of the 5, 1 had losses, 0 had losses >2%
Mixed equities: : Total 11. Of the 11, 5 had losses, 2 had losses >2%
***********
As I mentioned earlier I am now only trading ETFs in my 5 accounts to calm things down, lower my risk, and allow time for other things.
So far going well. I am 90% invested as follows:
9/21/18, Expiration cycle 10/19 – All are 1 month CC, ROO% stated is at expiration In The Money of current cycle 10/19, Purchase date of underlying is stated):
EWW 6.3% (8/28)
IBB 3.7% (8/20)
XBI 4.7% (9/6)
XRT 1.75% (9/25)
KBE 1.65% (9/25)
XLF 1.45% (9/27)
KBE is very close to 20% rule with current price Strike 48 at 0.25 to close. Have BTC order at 0.20.
***********
Mario
Mario,
thanks for sharing.
I wish to share mine too.
I’m 99.5% invested, all in stocks, and all with 09/21 calls (buy/write).
PYPL, GRUB, IRBT, CYBR, NSP, PANW, ADBE, WWE, AVGO, NVDA, ATVI.
Roni
Alan,
I have narrowed down my list of 5 stocks as per below (FYI I am assuming $50k capital and therefore <$100 stocks)
1. BEAT (Medical)
2. COLM (Apparel)
3. WWE (Media)
4. SHAK (Retail)
5. SSNC (Software)
I then looked at the 3 criteria:
1. Market direction: bullish based on SP500 & VIX
2. Stock technical: all stocks chosen are bullish
3. Risk tolerance: Avg
Understanding your latest report you are selling an equal number of ITM and OTM strikes. My question is based on above how do I determine which stock to choose ITM vs OTM, especially since all stock technical are bullish?
Thanks again for your help.
Alvin
Alvin,
When we are selling multiple contracts of each underlying, we can “ladder” our strikes with each stock position.
In this case, it appears that 1 contract of each underlying will be utilized. Since 2 of the stocks are trading in the $90s and the other 3, $50s and $60s, I would dedicate an equal cash amount to OTM and ITM strikes. As an example (but not necessarily a recommendation):
WWE and COLM: ITM
BEAT, SHAK and SSNC: OTM
This would result in an equal cash allocation to each strike type.
Alan
Premium Members,
The Weekly Report for 09/28/18 has been revised and uploaded to the Premium Member website. Look for the report dated 09/28/18-RevA. The reason for the revision is due to updated risk/reward data.
Three stocks were impacted:
NFLX moved from “Pass” to “Fail”
TEAM moved from “Pass” to “Fail”
WWE moved from “Pass” to “Fail”
Best,
Barry and The Blue Collar Investor team
barry@thebluecollarinvestor.com
Barry,
Can you comment further why the 3 stock moved to “Fail” Looking at the price charts outright does not seem to indicate an issue.
I noticed that:
WWE was in the 9/21 Run list as a Positive, then moved to mixed in the 9/28 original list. Looking at the 1 month chart, it crossed the EMA 20 avg on 10/1 MACD not promising on 9/28
NFLX was in the 9/21 and 9/28 original lists.
TEAM was a new addition to the run list on 9/28. Had been # of weeks on run list at 32. Looking at the 1 month chart, very close to EMA 20 avg. MACD not positive.
I will admit I normally do not look at evaluating the indicators. Just referring to the Run list for guidance.
Thanks.
Mario
Mario,
In all three cases, the risk/reward values dropped below 5 which is Alan’s cutoff point. In the near future, we will be moving to a different metric to gives us an additional objective, third-party view of the stock. The current data source terms of use have changed and this has required us to find an alternative metric.
Best,
Barry
Members,
I want to clarify that those members who currently hold positions in one or more these stocks (me included) should not close current positions based on this metric change. We manage according to our exit strategy arsenal, if needed. If we open new positions, other candidates are currently considered stronger considerations.
Alan
Allan,
I have two questions for you.
I wrote a poor man’s covered call on TEAM, it’s been open for awhile. I see that TEAM moved from the Pass to the Failed list. When you have a call that is open and it moves to the Fail list is your strategy to close it immediately or keep it open and just monitor it closely. Does the Pass list just apply to new Calls that you are considering to write?
Second question, do you have or has any users documented how to cut and paste the excel spreadsheet out of the pdf and paste it into Excel? I have not been able to do it.
Thanks,
John
John,
Alan answered your first question in his post above yours.
It was probably posted before yours was processed.
On your second question, I have been unable to cut and paste so I don’t think it’s possible to do so.
Before I sold my company and retired we had software that could convert an Excel spreadsheet into a PDF. I don’t remember having anything to convert a PDF into a spreadsheet.
I thought for a while that it would be helpful to convert the Weekly Report to a spreadsheet, and it might still be, but I have moved on from that.
Good luck in your trades.
Hoyt T
John,
It is possible to convert a PDF to a spreadsheet. Adobe can do this online. However the Weekly Report is password protected and can’t be exported into Excel for conversion.
Here are the instructions:
How to convert a PDF file to Excel:
Open a file in Acrobat.
Click on the Export PDF tool in the right pane.
Choose spreadsheet as your export format, and then select Microsoft Excel Workbook.
Click Export. …
Name the Excel file and save it in a desired location.
Convert PDF to Excel, PDF to XLSX converter | Adobe Acrobat DC
https://acrobat.adobe.com/us/en/acrobat/how-to/pdf-to-excel-xlsx-converter.html
Hoyt T
Hello John,
Because of previous issues, we do not make the Weekly Stock Report available as an Excel file. The report is uploaded using a secured PDF format. You can, however, copy the list of stocks that have passed the weekly screen using the stock listing on the “Running List” page.
Best,
Barry
hi Alan and senior members
I’ m trying to use the daily covered call checkup downloaded from the premium member site.
It looks awesome but sadly it does not seem to work properly.
I mean the cell on the bottom part of the excell file the one numbered from 21 to 32 don t fil in automatically when the upper cells are updated
can you kindly help me?
thanks
P.S. Thanks a lot Mario for your answer will need to read it many times to properly understand
Federico, Thanks for your feedback. Ask me any time what part or parts you don’t understand with the Mid-Contract Unwind (MCU) reply I gave and setting the Credit Limits for the Unwind order. It took me a long time understand it as well (lot of nervous states in the beginning) since you are assimilate a lot of concepts. It will help others as well.
Remember to use the Google search as well in this blog to pick up information from previous Blog responses. Great asset.
Mario
Also tell me what brokers you are using. I use Fidelity and Etrade.
Mario
Federico,
Make sure to click on “enable editing” on the top of the spreadsheet.
Alan
I m sorry i was wrong it works perfectly
thanks
Alan do you use covered call protection such as puts in your covered call strategy? Which option strategy do you feel is most productive, weekly options or monthly? Seems
thy would be the same bt maybe not. I always have used weekly.
Thank you this is my first week, I am sure I will have more questions after I review your videos
Thank you!
Harry
Harry,
Protective puts offer the benefit of downside protection against catastrophic price decline. In return, we are accepting lower overall returns due to the cost of the puts. When used with covered call writing, the strategy is known as the collar strategy, a topic covered in our recent publication, “Covered Call Writing Alternative Strategies”
https://thebluecollarinvestor.com/minimembership/covered-call-writing-alernative-strategies/
The BCI team also created a calculator for this and other strategies found in that book:
https://thebluecollarinvestor.com/minimembership/calculator-package/
The use of protective puts does not preclude our critical implementation of exit strategy opportunities when they arise. Use of protective puts should be based on personal risk tolerance.
My personal preference is Monthlys over Weeklys but each have their pros and cons. For example, Weeklys make it easier to circumvent earnings reports and ex-dividend dates but have 4 – 5 times the number and amount of trading commissions.
Check the file, “Weekly Options Pros & Cons” in the “resources/downloads” section of the premium member site.
Alan
Hi Harry,
most of the times when I look at Weeklys, the open interest is very low and the bid/ask spread is very high, while the Monthlys look much better.
The BCI methodology guidelines are: OI above 100, and spread within $0.30.
Roni
Premium members:
This week’s 8-page report of top-performing ETFs and analysis of ALL Select Sector Components has been uploaded to your premium site. The report also lists Top-performing ETFs with Weekly options as well as the implied volatility of all eligible candidates.
New members check out the video user guide located above the recent reports.
For your convenience, here is the link to login to the premium site:
https://www.thebluecollarinvestor.com/member/login.php
NOT A PREMIUM MEMBER? Check out this link:
https://www.thebluecollarinvestor.com/membership.shtml
Alan and the BCI team
Well friends, some here will recall the old song “Momma’ told me there’d be days like this, there’d be days like this my Momma’ said” :)?
I am actually surprised we have not seen more of them before now. And by the end it was not that terrible. Call it interest rate fear, trade wars, seasonality, sector rotation, pre-election jitters, whatever you like. It attests to the value of options selling, not over loading one sector, layering strikes and having dry powder.
I did a little buying mid day also selling a couple CSP’s further underneath. It helps to keep some cash on hand for when things go on a “surprise sale” :)! Build it when things are going up so you will have it when they are not. – Jay