
Technical analysis is an integral part of mastering covered call writing. This week’s article is a follow-up to an article posted on October 19th. In this week’s column I will […]
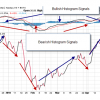
MACD: A Lagging and Momentum Technical Indicator: Part I
Technical analysis is as much an art as it is a science. No one parameter, by itself, will allow us to make our buy/sell decisions. However, when all the indicators […]

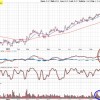
Technical Analysis: How to Use Volume in our Covered Call Decisions
When learning how to trade options volume must always be factored in. Volume is the number of shares or contracts that trade over a specific period of time, usually one […]

BLUE COLLAR INVESTOR Q&A- Your Questions Answered
This past Thursday and Saturday I conducted a webinar series attended by investors throughout the United States and Canada. I am humbled by the response and supportive emails that you […]
 Podcast
- 124. Dividends and After-Hours News Causing Exercise of OTM Call Strikes
- 123. Implied Volatility, IV Rank and IV Percentile Defined and Practical Applications
- BCI PODCAST 122: Should I Roll-Out My Deep In-The-Money Call Option Mid-Contract?
- BCI PODCAST 121: What is a SPAC (Special Purpose Acquisition Company)?
- 120. Using the Nasdaq-100 Volatility Index (VOLQ) in Covered Call Writing Decisions
- 119. Establishing Our Cost-Basis for Long-Term Holdings
- 118. Adjusting Our Portfolio Mix to Achieve Diversification and Cash Allocation
- 117. When a Covered Call Strike Moves $1000.00 In-The-Money
- 116. How to Execute a Covered Call Trade with a Buy/Write Combination Form
- 115. Establishing Our Cost Basis When Rolling-Out-And-Up On 2 Different Days


Recent Comments