Technical analysis is one of the 3 screens we use for stock selection when selling options. The other two are fundamental analysis and common-sense principles (like minimum trading volume). In August 2019, Nick wrote to me about a trade opportunity he thought he missed with WEN. He attached a technical chart followed by a question.
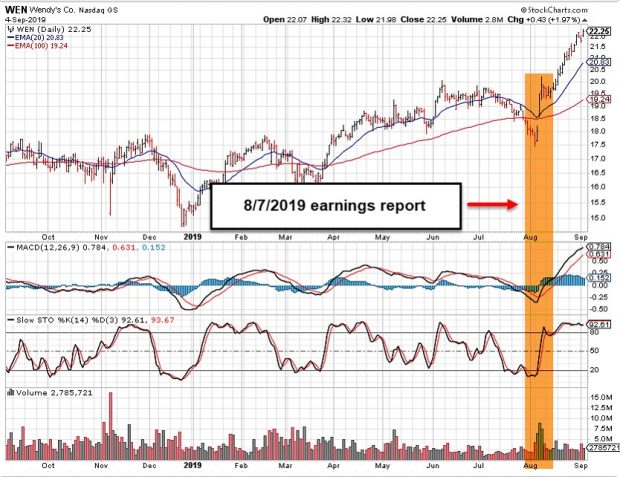
Price chart for WEN from 7/1/2019 – 9/9/2019

WEN: Price Chart
Nick’s question
Hi Alan,
I wondering if you can confirm the way I’ve set up my technical charts and am interpreting them. The chart is for WEN from 7/1/19-9/9/19. Unfortunately, I did not act on this chart but I’ll recognize it next time if I’m reading this correctly.
There are 4 positive signals in this chart
1) and 2). Jump in stock price corresponding with high volume.
3). MACD Histogram Value line (blue) crossed the Average (yellow) line and histogram is above 0 in GREEN
4). Slow Stochastic line cross 20% oversold line twice and Slow K line (14 day) crosses the Slow D line (3 day). This all corresponds with MACD Histogram going GREEN
Mostly I’d like to know if the charts you look at look are the same for the WEN over the same period of 7/1/19-9/9/19.
Thanks so much,
Nick
The chart at first glance
We have a completely bullish chart with moving averages, MACD histogram, the stochastic oscillator and volume all resulting in a bullish mosaic. The most glaring feature of the chart is the gap-up in price in the first week of August on extremely high volume, a point noted by Nick in his email. What might have caused this gap-up? Altogether now… an earnings report. That is precisely what caused this event… a favorable August 7th earnings release.
Focusing in on the impact of the earnings report
WEN Price Chart Showing an Earnings Report Gap-Up
Prior to August 7th, the stock was in a downtrend with all technical parameters reading bearish (to the left of the brown field). This stock would not have met our system criteria prior to the report plus we would not want to own it through the report. If the stock was already in our portfolio as a long-term holding, the option would not have been written until after the report passed, giving us the best of both worlds: enjoying share appreciation resulting from the bullish report and then generating additional premium from the post-report option sale.
Post report analysis
After the report and gap-up, the price chart reads “all systems go” and this would become a viable underlying for consideration from this technical perspective. From 8/7/2019 through 9/9/2019, WEN appreciated from $18.75 to $22.25.
Discussion
Price charts tell a story regarding trend and momentum. It could also alert us to certain events that should influence how we manage our trades. The chart Nick sent shows how earnings report can change the entire technical picture of a stock as well as the risk inherent in holding a stock through the report. Let’s face facts: a disappointing report may have resulted in a gap-down.
***For information on how to use technical analysis for strike selection, click here.
Market update with BCI assessment
I am in 50% cash with better-performing stocks as well as Inverse ETFs populating the remainder of my portfolios. Most inverse ETF options are now in-the-money due the 9% decline in the market this past week. The declaration of a national emergency and legislation dealing with the crisis resulted in an upbeat conclusion to the trading week. Fear and panic have overtaken the market while strong underlying fundamentals are awaiting a return to the bull market in my humble opinion. I am watching for an established bottom with retesting on low selling volume to define a bottom and then start re-investing the cash I have on the sidelines. This week’s Fed meeting is critical as investors are anticipating another rate cut of 50 basis points or more with favorable comments regarding Fed intervention. I remain long-term bullish.
Your generous testimonials
Over the years, the BCI community has been incredibly gracious by sending our BCI team email testimonials sharing stories as to what our educational content has meant to their families. Moving forward, we have decided to share some of these testimonials in our blog articles. We will never use a last name unless given permission:
Dear Alan,
I am very impressed with your YouTube video describing how to increase dividend yields using LEAPS. I have been watching your videos for years and I enjoy everything that you do.
Regards,
Mike H
Upcoming event
Wednesday April 8, 2020 Options Industry Council (OIC) Free Webinar
4:30 ET
Covered Call Writing to Generate Monthly Cash-Flow:
Option Basics and Practical Application

***********************************************************************************************************************
Market tone data is now located on page 1 of our premium member stock reports and page 8 of our mid-week ETF reports.
*********************************************************************************************************************

Hi Alan
I just wanted to say thanks for the great webinar this Weds evening – I joined late at night from the UK!
I really like the overall strategy of using the Dow 30 to generate cash for building a QQQ fund.
I picked up on your remark about ITM covered calls often being overlooked by covered call writers. In these bearish conditions right now, would you propose just writing 100% ITM calls or just sit in cash at the moment? Are there any times when you write all ITM calls for a given month or only partially?
thanks
Justin
Justin,
Yes, using ITM calls gives us additional downside protection in challenging market conditions which we are currently experiencing. This is due to the intrinsic-value component of the option premium which is a benefit only for ITM strikes.
Now, I have been completly transparent that I am using inverse ETFs lately which appreciate as the market declines. For these, I have been writing OTM calls.
In normal market conditions, I have a mix of ITM and OTM strikes depending on overall market assessment and chart technicals.
Whether we are using ITM or OTM strikes, we place our BTC limit orders to close the short calls if option prices moves down to meet our 20%/10% guideline thresholds (see the exit strategy sections of my books/DVDs).
Glad you enjoyed my presentation.
Alan
Thanks Alan
Unfortunately I can’t access options on inverse ETFs or any ETF in the UK.
Yes, am fully versed in your exit strategies from your encyclopedia which I enjoyed.
best wishes
Justin
Hi Justin,
I liked your comment about ITM calls. Last year, every single trade I made was ITM. I averaged 2.3% monthly returns with NO losing trades, even hit a double once.
Im pretty conservative also, just thought I would pass along.
-Mark
Premium Members,
This week’s Weekly Stock Screen And Watch List has been uploaded to The Blue Collar Investor premium member site and is available for download in the “Reports” section. Look for the report dated 03/13/20.
Also, be sure to check out the latest BCI Training Videos and “Ask Alan” segments. You can view them at The Blue Collar YouTube Channel. For your convenience, the link to the BCI YouTube Channel is:
http://www.youtube.com/user/BlueCollarInvestor
Best,
Barry and The Blue Collar Investor Team
barry@thebluecollarinvestor.com
Hi Alan
How are you? how is your family? I hope everything is doing well.
Allan, are we in a bear market right now?
Have a good day
Daniel
Daniel,
The technical definition of a bear market is when it drops 20% from recent highs and that did occur last week. This should turn around once we have an answer for the coronavirus crisis and there have been some good signs in other countries. Public perception on how our government (Fed, White House, CDC and Congress) is managing the crisis will also be reflected in our markets.
Most investors new to options and investing in general, should consider moving to a certain percentage of cash (50% for me and I’ve been investing your decades) until markets stabilize and volatility subsides.
That said, money can still be made even in these challenging times. Deep in-the-money calls and deep out-of-the-money puts along with inverse ETFs are some of the ideas we may want to consider.
For new members, I encourage you to paper-trade through these market aberrations as they are few and far between but meaningful lessons can be learned.
Alan
Hi Alan
How are you? Thanks very much for your email.
Could you give an example of inverse ETFS?
Best Regard
Daniel
Daniel,
Here are links to articles I have published on this topic:
https://www.thebluecollarinvestor.com/covered-call-writing-and-inverse-etfs-generating-cash-in-extreme-bear-markets/
https://www.thebluecollarinvestor.com/inverse-exchage-traded-funds-and-covered-call-writing/
https://www.thebluecollarinvestor.com/inverse-exchange-traded-funds-versus-shorting-stocks/
Each week we publish a graph of the most liquid inverse ETFs on page 6 of our premium member ETF Reports.
Alan
Alan,
Have you or could you do a video on the current market situation ( Corona) and what are some ways to follow or find possible stocks that are affected, but would be great candidates to get into now that will eventually be a great stock to add to a portfolio.
Maybe review specific stocks or sectors that might be a little more affordable now that we could eventually write calls against in the future.
Jeff
Jeff,
My team and I spend many hours each week to locate such stocks and ETFs. On our last stock report, only 5 passed our rigorous screens, well below norms. The current market conditions may be appropriate only for more experienced investors who have been through bear and volatile markets. With the VIX (CBOE Volatility Index) at 57 extreme movements in both directions are likely.
I have been in 50% cash and using a few of the stocks/ETFs taken from our reports with a heavier presence of inverse ETFs which move higher as markets move lower (see screenshot below).
CLICK ON IMAGE TO ENLARGE & USE THE BACK ARROW TO RETURN TO BLOG.
Alan
Alan,
I forgot all about inverse etfs until you mentioned them about 10 days ago. I decided to buy them and write otm calls. After today, all are deep in the money.
For example, I bought sh for 26.67 and sold the 27 strike. Now, the stock is 30.69 and the b-a spread is 3.50-4.00. I’m pleased that I made money but wondering if there is any action I should take at this time.
Thanks for any thoughts,
Marsha
Marsha,
I am in a similar situation with my inverse ETF positions. Since we are only a few days from expiration of the March contracts, there are few opportunities to take advantage of time-value premium (see my publications about Theta). Our trades are at maximum profit scenarios.
I can’t tell you what to do but I’m happy to share with you that I am continuing to monitor all my positions and taking no action at this time.
Alan
Dear All,
This situation is hell.
The virus ia spreading and killing.
Nobody knows what will happen.
I was lucky to be assigned most of my Feb 21 calls and I sold the remaining 2 stocks, PYPL and TEAM before they lost more than 10%. Still, it cost me 10,000.00. Sniff 🙁
I am now 100% in cash since early March, and will only come back when the pandemic is over.
Both me and my wife are isolated in our home (apartment) here in Sao Paulo – Brazil before this arrives here, because we are high risk ages, 75 and 86 respectively.
Roni
Roni,
Stay safe my brother. We will all come through this thing together.
Best,
Barry
Thank you so much Barry,
I believe we will all be well in a few months, and will go back to trading normally.
Roni
Roni,
I echo Barry’s words.
I hope you have someone who can bring you and your wife food and medicine.
My wife and I are in isolation also. I have two health issues, including my age, that put me at particular risk. My 99 year old mother has lived with us for the last 13 years.We have my sons, their wives and our grandchildren to bring us food and medicine so we are most fortunate.
I believe it is good that you went to 100% cash. About a week ago I went to enough cash to see me through the next few years. 🙂
I think it is wrong to get back in the market until we see the following chart pattern. Higher highs and higher lows. What we are seeing now is lower highs and lower lows. As long as the current chart hols my advice is to sit out the market. Waiting for the chart to change, and it will, will not get you in at the bottom but will get you back invested in time to make plenty of money.
God bless you and your wife. Please keep us posted as to your condition.
Hoyt T
Thank you Hoyt for all the good wishes and advice.
We do have our children and grand children, but we prefer to have the least contact with them.
We are well stocked on food, water and medicine, and I can order more by online suppliers.
Brazil is not yet badly affected. The first casualty happened today, and the government has taken strong measures to avoid contamination.
I am worried abut you and your wife too, and exprct that you will be fine by staying in isolation.
If all goes well, we will all be back to trading eventually, but the fallout can be huge if a vaccine is not developped soon.
Best wishes – Roni
Hey Roni,
I echo the kind wishes of all and am glad you.are well.
As usual, cash is king when times get turbulent so your position is excellent.
I bought about enough SH to offset the stuff I did not sell so the account is in stalemate for now. The rest is in cash.
Just as this is the fastest crash in history I hope it will also be the fastest recovery! Yet we likely have a ways to go until the bottom. So if not in cash already it makes sense to add some on bear market bounce days – which can be sizeable – and buy some SH also. Yet this too shall pass. – Jay
Thanks Jay,
I was about to ask news from you, since you you were absent from the blog for several days.
It is good to know you are well and trading.
Take care – Roni
2008 – 2020 market declines:
Below is an interesting chart published by Dr. Eric Wish of the University of Maryland (www.wishingwealthblog.com) comparing the current market decline with that of 2008.
If we can get past these challenging times, there will be amazing opportunities on the other side just as there were in 2009.
CLICK ON IMAGE TO ENLARGE & USE THE BACK ARROW TO RETURN TO BLOG.
Alan
Roni,
I echo Barry’s words.
I hope you have someone who can bring you and your wife food and medicine.
My wife and I are in isolation also. I have two health issues, including my age, that put me at particular risk. My 99 year old mother has lived with us for the last 13 years.We have my sons, their wives and our grandchildren to bring us food and medicine so we are most fortunate.
I believe it is good that you went to 100% cash. About a week ago I went to enough cash to see me through the next few years. 🙂
I think it is wrong to get back in the market until we see the following chart pattern. Higher highs and higher lows. What we are seeing now is lower highs and lower lows. As long as the current chart holds my advice is to sit out the market. Waiting for the chart to change, and it will, will not get you in at the bottom but will get you back invested in time to make plenty of money.
God bless you and your wife. Please keep us posted as to your condition.
Hoyt T
Alan,
I’ve been reading comments about inverse ETFs on this site. I never knew about them but they seem to be useful in markets like this one.
My question is do we get dividends from these ETFs?
Thanks for all you do.
Evan
Evan,
Yes, quarterly dividends between 1% – 2% annualized.
Dividend distribution is not the reason we use these securities but can be considered “icing on the cake”
They are quite useful in confirmed bear markets and should be abandoned when markets start to turn bullish.
Alan
Premium members:
This week’s 8-page report of top-performing ETFs and analysis of ALL Select Sector Components has been uploaded to your premium site. The report also lists Top-performing ETFs with Weekly options as well as the implied volatility of all eligible candidates.
Also included is the mid-week market tone at the end of the report.
For your convenience, here is the link to login to the premium site:
https://www.thebluecollarinvestor.com/member/login.php
NOT A PREMIUM MEMBER? Check out this link:
https://www.thebluecollarinvestor.com/membership.shtml
Alan and the BCI team