Covered call writing and selling cash-secured puts are low-risk option-selling strategies used to generate monthly cash flow. Low-risk does not mean no risk so how can we measure the degree of risk we are undertaking? Let’s first all agree that any strategy that aspires to generate higher than a risk-free return (Treasuries, for example) will incur some degree of risk. Portfolio managers and institutional investors focus in on market risk like a laser and use Delta in many instances to ascertain and manage market risk (also called systematic risk).
Delta-Neutral Portfolios
These are portfolios consisting of positive and negative Delta positions which balance out to bring the net change to zero. Institutional traders use Delta-neutral positions to eliminate risk from their positions. For example, if 1000 shares of stock are purchased for a positive Delta of +1000, the trader may then purchase 200 put contracts with a delta of -0.5, thereby creating a Delta-neutral position. If share value declines, put value increases.
Delta and option-selling
Both covered call writing and selling cash-secured puts are Delta-positive positions. When we write a covered call we are long the stock (Delta = +1) and short the call option (negative Delta, but less than -1) resulting in a positive overall Delta. When we sell a cash-secured put we are short a negative Delta which results in a positive Delta (remember as a kid…two negatives don’t make a positive? Here is does!).
Delta and Greek calculators
Delta is not a static figure. It changes with the other Greeks (Gamma, Vega, Theta, not so much Rho). To get a precise Delta stat, we must use a Greek calculator to compute current implied volatility based on current option premium. To demonstrate the process, I have selected TAL Education Group (XRS), a stock taken from the Premium Watch List on 2/4/2016. At the time, XRS was trading at $47.95 and the market was bearish so we will explore the in-the-money $45.00 call option (premium $4.30) and the out-of-the-money $45.00 put option (premium $1.23). Both are bearish and defensive option-selling positions that generated more than 2% for a 6-week return with significant downside protection.
Delta calculation for XRS $45.00 call option

XRS: $45.00 Call Delta Calculations
We calculated the current implied volatility in the purple field on the bottom right by entering current premium of $4.30 and then entering the 40.45 in the purple field on the left side. The stock price and option strike price were also entered and “calculate” in the middle of the screenshot resulting in a Delta figure of 0.7038 (brown field on right).
Delta calculation for XRS $45.00 put option

XRS: $45.00 Put Delta Calculations
The same process calculated a put Delta of -0.2900.
Comparing the put and call Delta positions
Since the positions are both $2.95 away from the strike price and there is not a dividend to skew the premiums, we would expect a similar Delta position…let’s see:
Covered call writing
Long stock (+1) – short call (-0.7038) = +0.2962
Selling cash-secured put
Short put Delta = (-) -0.2900 = +0.2900
As expected, the Delta positions are virtually the same.
The Collar and Delta
If we bought a protective put in association with a covered call (Delta-positive) position (known as the collar strategy), we would be adding in a negative Delta component. This would reduce our market exposure as we move closer to a Delta-neutral position, precisely the reason one would consider buying a protective put
Putting this in perspective/Discussion
When selling options we are in Delta positive positions which means we are exposed to market risk. This is part of any strategy that strives to generate higher than a risk-free return. Most investors have portfolios consisting of stock only (individual or part of a mutual fund or exchange-traded fund). These portfolios have Delta positions of +1 with even greater exposure to market risk. When deciding on the most appropriate investment strategies to place our hard-earned money, we must evaluate the inherent risk of that strategy versus our personal risk-tolerance.
Upcoming live events
September 23, 2016
3 PM – 4 PM
“All Stars of Option Trading”
CBOE (Chicago Board Options Exchange)
Chicago, Illinois
Event is sold out
September 29th, 2016
9 PM ET
Blue Hour webinar 2: “Using Put Options to Buy and Sell Stock”
FREE to premium members and available for purchase to general members
Registration links and more information to follow
October 17th, 2016 (originally 10/24)
Austin, Texas
Registration link and information
November 5, 2016
Plainview, New York
Saturday morning 3-hour workshop at the Plainview Holiday Inn. I am the only speaker and plan an information-packed presentation covering 5 actionable ways to make money or buy a stock at a discount using both call and put options. We will also evaluate the stocks you currently own for option-selling.
Save the date: Our next Blue Hour webinar, FREE to all Premium Members, will be broadcast on 9/29/2016 at 9 PM ET. The topic is Using Put Options to Buy and Sell Stock. This a new presentation which will be presented for the first time on September 29th. Registration will open in a few weeks. You will receive notification.
Why financial education is so important and why we can’t depend solely on the “experts”
From Thursday’s headlines
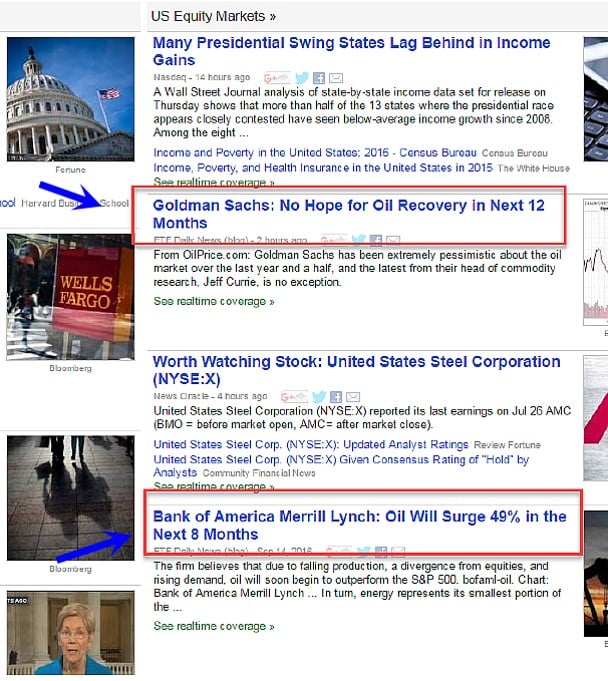
Experts Predict the Future of Oil Prices
Market tone
Global stocks were mixed this week, with markets continuing to focus on central bank policy. Volatility spiked higher this week, with the Chicago Board Options Exchange Volatility Index (VIX) rising to 15.42 from 14.72 a week ago. Crude oil fell to $42.82 per barrel from $46.50. This week’s reports and international news of importance:
- Muted US economic data and a rise in market volatility combined to lower the odds of a move at next week’s Federal Open Market Committee meeting or at the final meeting of the year in December. While there is a meeting in early November, markets widely expect the Fed to refrain from changing policy just days before a presidential election
- Sub-par August retail sales (-0.3%) and a dip in industrial production (-0.4%) were widely viewed as allowing the Fed to hold rates steady in the months ahead despite a mild uptick in consumer prices (0.2%)
- An advance in CPI was led by medical costs and rents
- UK August retail sales dipped 0.2%, as stellar July sales were revised even higher, to 1.9% from 1.4% previously, the biggest gain in 14 months
- UK unemployment rate held steady at 4.9%
- The Bank of England’s Monetary Policy Committee met Thursday and held policy steady, but indicated it could ease again before the end of the year if necessary
- China’s economy is showing signs of modest improvement, recent data show. In August, industrial output advanced 6.3% while retail sales rose 10.6
- The International Energy Agency forecast this week that the surplus in the global oil market will last into late 2017, longer than previously expected
- According to the US Census Bureau, median household incomes rose 5.2% in 2015, the largest annual rise on record. The increase was the first in seven years but remains 1.6% below the 2007 level before the recession and 2.4% below the 1999 peak
- After an underground test of a nuclear warhead late last week, the North Korean government pushed for recognition as a legitimate nuclear weapons state. The US countered the test by sending two B-1B bombers to fly over South Korea in a show of force
- The Swiss National Bank held its policy rate steady at -0.75% at its quarterly rate-setting meeting. The bank said that the negative interest rate and its willingness to intervene in the foreign exchange market are intended to make Swiss franc investments less attractive, easing upward pressure on the currency
- The Japanese press this week reported that the Bank of Japan may explore pushing policy rates deeper into negative territory in a strategy shift
THE WEEK AHEAD
- US housing starts and building permits are reported on Tuesday, September 20th
- The Bank of Japan and the US Federal Reserve hold rate-setting meetings concluding on Wednesday, September 21st
- US existing home sales data are reported on Thursday, September 22nd
- ECB president Mario Draghi speaks on Thursday, September 22nd
- Flash purchasing managers’ indices are released on Friday, September 23rd
For the week, the S&P 500 ticked up by 0.53% for a year-to-date return of +4.66%.
Summary
IBD: Uptrend under pressure
GMI: 1/6- Sell signal since market close of September 12, 2016
BCI: Recent market volatility has guided me to a more defensive posture as we enter the October contracts. I will be favoring in-the-money strikes 2-to-1.
WHAT THE BROAD MARKET INDICATORS (S&P 500 AND VIX) ARE TELLING US


Premium Members,
This week’s Weekly Stock Screen And Watch List has been uploaded to The Blue Collar Investor premium member site and is available for download in the “Reports” section. Look for the report dated 09/16/16.
Also, be sure to check out the latest BCI Training Videos and “Ask Alan” segments. You can view them at The Blue Collar YouTube Channel. For your convenience, the link to the BCI YouTube Channel is:
http://www.youtube.com/user/BlueCollarInvestor
Best,
Barry and The Blue Collar Investor Team
Alan,
Can you please tell me what you think about another strategy I’m considering?
I have $150K to invest…considering buying 500 shares of SPY and selling weekly covered call contracts just above the money. I would invest 1/3 the amount of the SPY investment in SPXU to use as a hedge. Seems like a win-win whether SPY goes up or down…what am I missing?
Thanks,
Dan
Dan,
There certainly is some impressive rationale behind your thinking but there are always drawbacks when we seek to achieve higher than risk-free returns.
Your strategy seeks to create a Delta-neutral portfolio which is what many professional portfolio managers simulate. To do so, you are using an inverse leveraged ETF. Assuming we achieve Delta-neutral status we are eliminating or dramatically decreasing share appreciation as a source of income. Secondly, leveraged ETFs rarely simulate the long-term performance of the underlying benchmark because its target goal is based on a daily return:
https://www.thebluecollarinvestor.com/the-mechanics-of-leveraged-exchange-traded-funds-appropriate-for-covered-call-writers/
Using Weeklys also have pros and cons attached to them.
I’d paper-trade the strategy before deciding if this approach meets your goals.
Alan
Dan, could you please explain this for a novice like me? Using some numbers would be great.
Thank you,
Michael
Michael,
Delta is a measure of how much a security will change for every $1.00 change in the underlying. By definition, stocks have Deltas of “1” The higher the Delta, the more exposure we have to market risk.
Example:
Buy 300 shares of BCI at $45.00: Delta = +300
We can reduce market risk by selling call options. Let’s say we sell 3 contracts of an at-the-money strike ($45.00 call): ATM options have Deltas near 0.5 so we would be negative 150 Deltas leaving a total portfolio position of +150 Deltas (300 – 150).
We can further reduce market risk by buying a protective put (puts have negative Deltas). Let’s say we buy a $40.00 put (protecting us from share decline below $40.00) and assign a Delta of (-) 0.25 or (-) 75 Deltas for 300 shares. This now reduces our portfolio Deltas to +75 Deltas, one fourth the original +300.
It is not essential to run these calculations for all our positions but it is important to understand how options can reduce our market risk and Deltas is the vehicle that assists in this explanation.
Alan
Alan, thank you, I understand how positive and negative deltas tend to cancel each other. What I was looking for when I asked for numbers was an example with the two possible scenarios (stock moves up or down) and why this strategy helps.
Thank you,
Michael
Michael,
The intent of this article and many others that I write is to provide information that enhances our knowledge of option-selling strategies. In this case, it is to explain, using one of the option Greeks, why covered call writing and protective puts (collar strategy) reduces market risk. This is why I highlighted the following:
“It is not essential to run these calculations for all our positions but it is important to understand how options can reduce our market risk and Deltas is the vehicle that assists in this explanation”
In the example I gave, Delta was reduced from 300 to 75.
In the past, I have written related articles on “pinning the strike”
https://www.thebluecollarinvestor.com/pinning-the-strike-a-covered-call-writing-consideration/
The article explains the price movement of options as expiration approaches also using Delta for analysis.
It’s all about the education.
Alan
Running list stocks in the news: NVDA:
Nvidia Corp., developer of 3-D graphic processors, produced a stellar 2nd quarter earnings report on 8/11/2016 with revenues up 9 % sequentially and 24% year-to-year. Earnings increased to $0.40 from $0.05 a year ago and up 21% from the last quarter. This has resulted in an increase in analysts estimates for the next 2 years.
Our Premium Watch List, just published a few hours ago, shows the following:
– Ranks #7 on the IBD 50
– Currently priced at $62.84
– In the “Chips” industry currently ranked “A”
– Has a Scouter Risk/Reward rank of “7”
– beta = 1.22
– % dividend yield = 0.70
– Last ex-date was 8/23/2016
– On our premium watch list for 10 weeks
– Next projected ER date is 11/10/2016
– Weeklys are associated with NVDA
– Current options chain shows adequate open interest for near-the-money strikes
– Current chart (9/18/2016) below)
Check to see if this security deserves a place in your portfolio based on your personal risk tolerance.
CLICK ON IMAGE TO ENLARGE & USE THE BACK ARROW TO RETURN TO BLOG
Alan
Alan,
NVDA has been very good to me since my first trade on 03/28/16.
Gained 3% on the first trade, and continued on all the next months (except pre earnings), averaging 2.5% each time.
My last entry on 08/15 is still active, and it looks like I may be hitting a double.
Following you method is the perfect strategy for me, and I wish all my trades could do as well as NVDA.
Thank you so much.
Roni
Alan,
Which of your books have information on exit strategies? I’m especially interested in the 20-10 rules I saw in one of your videos.
Thanks,
Paul
Paul,
All my books have significant information on position management. This is one of the 3 required skills for option-selling (stock selection and option selection are the other 2). Encyclopedia-classic has 50 pages on exit strategies and Encyclopedia-Volume 2 has 30 pages. “Exit Strategies for Covered Call Writing”, of course, is entirely dedicated to position management and I added the “mid-contract unwind” exit strategy in both Encyclopedias.
Alan
Allan,
I recently joined the annual membership and wonder why your team includes a few stocks that have inadequate open interest.
very happy with your service.
Helene
Helen,
We get this question a lot…
There are two reasons we include these stocks:
1- Open interest can change so rather than eliminate these elite-performers we include them and let our members know about the liquidity concern by x-hatching the OI column.
2- Many of our members use these lists for buying and selling stock only where option liquidity plays no role.
Alan
I will show you a papertrade with the MCU strategy from off the ETF, so I can get better understand where the final cost-basis and return lies.
26/1/16. – For ‘XLU’ – Buy 100sh’s @ $43.38, and STO 1x$43C @ 0.97c.
Profit= 0.59c/$43 = 1.37%.
4/2/16. – BTC 1x$43C @ $3.75.
– Sell Shares at $46.62.
Share gain = $3.24. / Options = – $2.78. / Total Pr. = 0.46c/$43 = 1.07%.
4/2/16. Buy next replacement stock called ‘FIVE’.
Buy 100sh’s @ $35.93, and STO 1x $33C @ $3.40.
Profit= 0.47c/$33 = 1.42%.
If the total return for this MCU is 2.49%, then what is the final cost-basis? (My calculation is probably wrong, but I calculated final cost-basis to $3,207. ($33 strike – 0.46c – 0.47c x 100shares?))
I subtracted the premiums off the $33 strike, as these papertrades were not re-invested as you had told me before.
I may have to even show you the rest from this month to establish the correct months return, before I can then start calculating for all my previous trades. Thanks very much.
Adrian,
Based on our previous discussions I know you are not looking at these calculations from a tax perspective but rather from a position evaluation perspective. These are two distinct covered call trades, one closed and the second open. The first (MCU) is calculated by using the “Unwind Now” tab of the Elite version of the Ellman Calculator (free to premium members in the “resources/downloads” section of the member site…scroll down to “E”). In the screenshot below, the calculations are shown for the initial trade.
The second trade where an in-the-money strike is sold shows a cost basis of $33.00 which is done correctly by deducting the intrinsic value from the premium.
So we have 2 distinct trades with 2 distinct cost basis stats. An analogy would be to buy and sell a stock and then use the cash to buy a second stock…what is the cost basis? Trade one is done…now on the trade 2.
Now, if you are looking to evaluate an entire portfolio’s progress over time:
Portfolio value now – portfolio value at the start of the evaluation period/portfolio value at the start of the evaluation period…voila…
CLICK ON IMAGE TO ENLARGE & USE THE BACK ARROW TO RETURN TO BLOG
Alan
Premium Members:
Registration is now open for our Blue Hour webinar for September 29th at 9 PM ET. This webinar is FREE to premium members. To join, login to our member site and click on the link shown below. Seating is limited to 100 but the presentation will be recorded and available and archived on the premium site in a few days.
If space permits, seats will be available for purchase for general members in a few days.
CLICK ON IMAGE TO ENLARGE & USE THE BACK ARROW TO RETURN TO BLOG
Alan
Alan,
I’ve never sold naked calls. I have calculated about 6 stocks on this weeks list. All are OTM except GIMO. If naked and not called I keep the premiums. On the 6 the cost would be $23364 if covered, premiums equal $1381 which equals 5.9%. Why not go naked?
Regards,
Richard
Richard,
The risks are similar and associated with share decline. In both strategies we have an option credit if options are not bought back. On the stock side for both strategies, there is risk of share value unrealized losses if stock price falls below the breakeven. If unrealized share loss is greater than the option premiums generated we are in a losing position. In your example, if share value drops below $21,983.00 ($23,364.00 – $1381.00) we are in a losing position. Of course that’s where our position management skills kick in.
There are slight differences between the two strategies and some similarities. See Figure 68 on page 214 of my book, “Selling Cash-Secured Puts” for a comparison chart of the two strategies with the ensuing pages detailing those comparisons.
Alan
I’m confused as to why you would write covered calls vs. cash secured puts. It seems they are essentially the same market trends and analysis required, but that the cash secured puts don’t require you to own the stock. Is one strategy better for certain markets conditions or maybe on is more liquid than another? Likely I will understand more after I continue to study your books…
Thanks again for the great educational videos to inspire me. You have truly demystified options for me – something I have not been able to do casually before now.
Brendon
Brendon,
Most retail investors will be required to set aside the cash in our brokerage accounts to purchase the shares should the put options get exercised. Hence the term “cash-secured” So the cash is still tied up whether in the form of buying the shares or securing the put.
In bear or volatile market environments I will enter a covered call trade by first selling an out-of-the-money cash-secured put. This offers another layer of downside protection using both out-of-the-money puts and then in-the-money calls. I refer to this as the PCP (Put-Call-Put) strategy in my put books and DVDs.
Alan
Hi Brandon,
I have asked myself the same puzzling question, and I have traded cash secured puts many times, to try and check the results.
My personal preference now is covered calls.
Why ?
Because I trade only one month BCI strategy, for consistent low risk cash generation.
That means I do not buy stocks to hold.
If your purpose is to hold shares of your favorite companies, the OTM cash secured put strategy will help you to get them at a discount if they get exercised, and iyou get to keep the premium if the option expires worthless.
But you must watch them closely, and exit before the loss is too big, if the stock goes far bellow your break even point.
Good luck – Roni
Premium members:
This week’s 8-page report of top-performing ETFs and analysis of ALL Select Sector Components has been uploaded to your premium site. The report also lists Top-performing ETFs with Weekly options.
We have also uploaded the 4th Quarter-2016 “Blue Chip Report” in the “Resources/Downloads” section of the site (right side…scroll down to “B”).
Registration opened yesterday for the new Blue Hour webinar broadcast live next Thursday at 9 PM ET. The topic is “Using Put Options to Buy and Sell Stock” It is FREE to premium members.
We are using a larger room to accommodate the demand and that room is now half full. Login to the member site and scroll down to “Blue Hour” on the left side to register:
For your convenience, here is the link to login to the premium site:
https://www.thebluecollarinvestor.com/member/login.php
NOT A PREMIUM MEMBER? Check out this link:
https://www.thebluecollarinvestor.com/membership.shtml
Alan and the BCI team