Mastering stock and strike price selection are key components in successful covered call writing. There is no one factor that will dictate our choices but rather a mosaic of bits of information which will lead us to the best selections. In this article, I will discuss two of those critical components: technical analysis of the underlying security and overall market assessment. Let’s start with viewing the chart of an elite performer on our Premium Watch List dated 4-4-14 (Continental Res, Inc. or CLR):
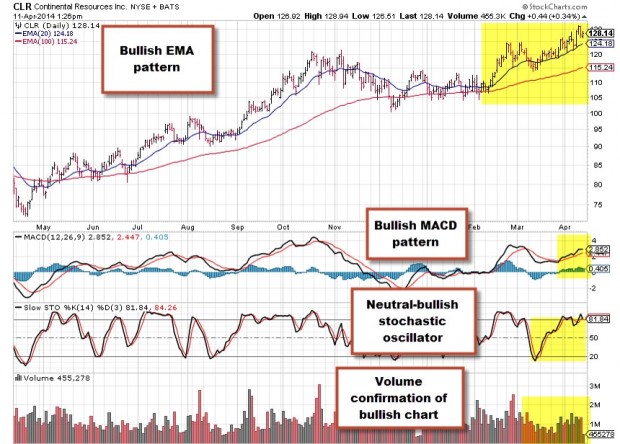
CLR- bullish chart pattern
At this point, we have an elite performer both fundamentally and technically and one would be leaning to selling one of the bullish out-of-the-money strikes. However, let’s have a look at the chart of the S&P 500 and VIX (CBOE Volatility Index or investor fear gauge) to evaluate our overall market assessment:

VIX rising this past week
S&P 500 versus the VIX
Note that in the past one month, the market volatility has increased significantly (15%) while the value of the S&P 500 has declined by 2.5%. For many investors, this red flag guides us from bullish out-of-the-money strikes to the more conservative in-the-money strikes giving us a bit of a cushion when it comes to capital preservation. Next, let’s view the options chain for CLR at the time I produced the above screenshots:

CLR- options chain
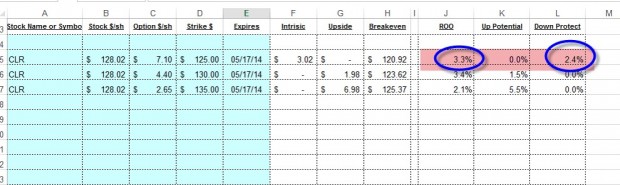
With CLR trading @ $128.02, we will evaluate the in-the-money $125 strike and out-of-the-money $130 and $135 strikes feeding the stats into the multiple tab of the Ellman Calculator:
Calculations for CLR
The out-of-the-money $130 and $135 strikes create the potential for returns of 4.9% and 7.6%, respectively. Neither offers downside protection of the time value. The in-the-money $125 strike generates a nice 3.3%, 5-week return (time value only) with downside protection of 2.4%. This means that we are guaranteed a 3.3%, 5-week return as long as our shares do not depreciate in value by more than 2.4% by expiration. I call this downside protection (very different from breakeven) an insurance policy that is paid for by the option buyer, not by us.
Conclusion
Many factors are considered when selecting underlying securities and strike prices for covered call writing. Taking the most bullish positions (out-of-the-money strikes) are most appropriate when both chart technicals are bullish and confirming as well as overall market assessment also bullish. If either component is compromised, selling in-the-money strikes will afford us downside protection and provide a cushion for capital preservation.
Next live seminar:
Saturday, June 14th
8:30 – 11 AM
Costa Mesa, California (Orange County)
BCI members who will be attending may want to get to the venue a bit early. I’m told by the chapter President that they are expecting a much larger attendance than normal based on the number of recent inquiries from non-chapter members.
Click for more information and registration
Market tone:
As some “talking heads” continue to forecast doom and gloom the economic reports continue to retort: “But what about this?”
- Total construction spending increased by 0.2% in April, below the 0.6% expected, and advanced for the 3rd straight month
- Construction spending is 8.6% above stats from a year ago
- The US trade deficit widened to $47.2 billion in April from $44.2 billion in March, the largest margin since July, 2012. The silver lining was the healthy import statistics
- According to the Federal Reserve Board, the Beige Book report noted expansion in all 12 of its regional districts
- Initial jobless claims for the week ending May 31st came in @ 312,000, below the 318,000 expected by analysts
- According to the Labor department, 217,000 jobs were added in May, meaning that the US Labor Market has now returned to pre-recession levels
- Unemployment remained @ 6.3% and the number of unemployed remained @ 9.8 million
- Compared to a year ago, unemployment is down 1.2% and the number of unemployed decreased by 1.9 million
- The ISM Manufacturing Index increased in May to 55.4 from 54.9 in April. Economists had projected a figure of 55.2
- All but one of the manufacturing industries showed growth in May
- The ISM Non-Manufacturing Index (measures service-sector trends) rose to 56.3 in April from 55.2 in March, the 4th straight monthly rise. The index is now at its highest point since August, 2013. Any reading above 50 signals expansion
- Both business activity and new orders indexes reached their highest levels since 2011, as 17 of the 18 nonmanufacturing industries showed growth (only the mining industry contracted)
- According to the Labor Department, nonfarm business productivity fell by 3.2% in the 1st quarter, worse than the decline of 1.0% expected. Severe weather conditions in January and February was largely responsible. Compared to a year ago, productivity is actually up 1%
- According to the Commerce Department new orders for manufactured goods rose by 0.7% in April, the 3rd straight monthly gain and well ahead of the 0.2% predicted by economists. March’s stats was revised higher by 1.5%
For the week, the S&P 500 rose by 1.3%, for a year-to-date return of 6.4%, including dividends.
Summary:
IBD: Confirmed uptrend
BCI: Moderately bullish favoring out-of-the-money strikes 2-to-1.
Wishing our members much success,
Alan (alan@thebluecollarinvestor.com)
www.thebluecollarinvestor.com
Apple Computer:
AAPL starts trading on its split-adjusted basis this Monday. That would be about $92/share based on Friday’s closing price of $645.57.
Alan
Premium Members,
The Weekly Report for 06-06-14 has been uploaded to the Premium Member website and is available for download.
Also, be sure to check out the latest BCI Training Videos and “Ask Alan” segments. You can view them at The Blue Collar YouTube Channel. For your convenience, the BCI YouTube Channel link is:
http://www.youtube.com/user/BlueCollarInvestor
Best,
Barry and The BCI Team
Alan,
I’ve come to assume that if I wanted to sell an OTM strike on a stock with great chart technicals yet the return is too low for this strike, but happens to be in the 2-4% goal for the ITM strike, then going with the ITM strike is what I guess I would do here (regardless of what the chart shows)?, can you please confirm on this?
Thanks,
Adrian
Adrian,
If our inclination is to sell an OTM strike that means we are bullish on the overall market and the stock itself. If our 1-month goal is 2-4% for initial returns (these are my personal goals but it can vary from investor to investor depending on personal risk tolerance) than we try to locate a stock that will generate such an initial return AND afford us the upside potential we are seeking.
Most of our premium watch lists will have an adequate amount of eligible candidates to meet these goals. As an aside, this week’s list may have set a BCI record for the number of eligible candidates. That is a reflection of the health of our stock market.
To summarize: If our goal is for an initial return of 2-4% with upside, go through our watch list of eligible candidates until such a security is found…it won’t be difficult. In bearish markets when the list is leaner, plan B would be to sell an ITM strike that generates a return that meets our initial goals.
Alan
Alan,
What effect does Apple’s split have on the dividend? Also divided by 7?
Thanks.
Joe
Joe,
Generally speaking yes but AAPL also raised its dividend to $3.29/share annually so on a split-adjusted basis that would come to a % divdend yield of 3.57% if AAPL opens @ $92 as shown in a screenshot of our premium running list published last night.
CLICK ON IMAGE TO ENLARGE & USE THE BACK ARROW TO RETURN TO THIS BLOG.
Alan
Premium Members:
This week’s Weekly Stock Screen And Watch List has been revised and uploaded to The Blue Collar Investor premium member site and is available for download in the “Reports” section. The print area for the third (“Cut and Paste”) section of the report had to be expanded due to the large number of stocks on the Running List. Although all of the data was there, a few of the stocks were outside of the print area.
Look for the report dated 06/06/14-REVA.
Best,
Barry and the BCI Team
Hi Alan,
I’m trying to figure out if I have a problem. On Friday I owned 200 shares of Union Pacific which was trading at $202+ and I had 2 contracts for the 6/13 $202.50 strike price covered.
Yesterday The UNP Board issued a 2/1 split distributed as a stock dividend. This morning I am the proud owner of 400 shares of UNP trading at $201.86. The problem appears to be I now have 4 contracts covered for a 101.25 strike price. Am I going to get called out Monday morning first thing and loose my dividend value? Or will this all get washed out in the computer by Monday morning? I am confused.
John
John,
You have no problem at all but you also haven’t received a bonanza! When a stock splits 2-for-1, the number of shares double but the share price is cut in half so on Monday you will own 400 shares @ $100.93 and will have sold 4 contracts with a $101.25 strike. Basically, you’re in the same position you were in prior to the split.
Alan
Alan,
I’m quite new at this business of option trading. But before I decide to or not to do this I must understand the rules. I read something on the following website that confused me.
http://www.cboe/LearnCenter/Concepts/Beyond/expiration.aspx
Namely, two questions: What is an automatic exercise” of an option?, and especially: What happens to my long option if I never sell or exercise it?
The last one is especially troubling to me. An explanation here would be helpful to me.
Thank you.
David
Hi David,
My responses:
The rules on these factors may vary from broker-to-broker but I can give you the typical scenarios:
1- Automatic exercise applies to short option positions (options you sold as in covered call writing). If the strike price ends up $0.01 or more in-the-money and you take no action, your shares will be sold at the strike price. For example, if you sold a $30 call and the stock closes above $30 on expiration Friday, your shares will be sold @ $30 the next day (Saturday). Of course, the cash will be in your account as the shares disappear.
2- A long option is not covered call writing as it conveys the right but not the obligation to buy or sell 100 shares of stock. Here the term is exercise by exception, rather than automatic exercise because you do not have to take control and buy the shares. If the strike ends up in-the-money as described above, you can notify your broker and the shares will not be purchased as the option expires. Of course, if you do not want to take possession of the stock and the strike is in-the-money, your option will have some value and should be sold prior to 4PM ET on expiration Friday. For example, if the stock is priced @ $35 and you sold the $30 call, the option value will be at least $5.
Alan
David, given you are brand new to options trading, make sure to start with paper trading until you thoroughly understand what you’re doing before you use real money. Steve
Running list stocks in the news: TDG:
TransDigm Group Incorporated (“TDG”) has declared a special cash dividend of $25.00 per share on its outstanding common stock. The special cash dividend has a record date of June 16, 2014 and a payable date of June 26, 2014. The ex-distribution date will be on Thursday, June 12, 2014.
Strike prices will be adjusted down by $25 as shown in the screenshot below. Share value will also decline by $25 so do not panic when you see a huge drop in share value because you will also capture that dividend. CLICK ON THE IMAGE TO ENLARGE & USE THE BACK ARROW TO RETURN TO THIS BLOG.
Alan
Alan, When I go to compare the price performance of S&P500 to any stock, then could I instead of using the “price comparison” on my charting software use the “relative strength” line? (if not then it doesn’t matter, it just seems easier to plot trendlines on the RS line than the other one, which is shown behind the price)? Thanks
Adrian,
Since we are undertaking 1-month obligations any indicator that you are comfortable with which will compare the recent price movement of the underlying security to the broad market index will work.
Alan