Covered call writing is a strategy we use to generate consistent monthly cash flow, re-invest profits and ultimately to become financially independent. We strive to beat the market by using sound fundamental, technical and common sense principles. But why are we getting paid more than treasuries, CDs or money market accounts? The answer is that we are generating these high returns for undertaking risk. The whole basis of the BCI methodology is to undertake modest risk and mitigate that risk through a series of guidelines and principles set forth in our books and DVD Programs. Wouldn’t it be great if we were to receive these higher returns and not be required to undertake any risk? That was a rhetorical question…deep down inside we all know that there is no legal way of accomplishing that goal. But it’s always fun trying to find that ultimate strategy that even the most sophisticated of computers has yet to uncover.
Recently, I responded to a comment made by Tony and felt it was worthy of a blog article because of the impressive thinking that went behind the inquiry as well as the lessons learned. The question presented was the following strategy, a “can’t-lose” approach to covered call writing?
Proposed strategy
- Sell a deep in-the-money strike with a 2% time value premium and downside protection of that profit
- If share price rises or drops less than the downside protection (intrinsic value of the premium), take no action
- If share price drops below the strike mid-contract, close the entire position and generate the 2% profit or a little less if the position is closed below the strike
Principles used to develop this strategy
Tony used his knowledge of the advantages presented to us of using in-the-money strikes. We can generate a time value component of the option premium which represents our initial profit and also have an insurance policy to protect that profit in the form of the intrinsic value component of the premium…intrinsic value protects the time value. It appears 0n the surface that if share depreciates and the position is closed as the strike is approached that we are fully protected and cannot lose (do you sense a “but” coming?).
The reality of options and why there is no free lunch
- A stock price can gap-down and even if we wanted to sell at the strike, there is no guarantee that we will get our price
- To generate a time value component of 2%, the strike can certainly be in-the-money but not deep in the money unless the stock has huge implied volatility which we generally try to avoid. This means that the strike selected will be below market value but not out-of-sight
- ***As the price of the stock approaches the strike originally sold that strike which was originally in-the-money is now at-the-money. Since the time value component of premiums is greatest for at-the-money strikes, the cost to close will most likely result in an options debit despite the impact of theta (time value erosion) mid-contract
- There will also be a small debit from the bid-ask spread, less of a factor than the option time value debit
Time value components for different strikes for FaceBook
The chart below shows the time value components for in-the-money and near-the-money strikes for FB:
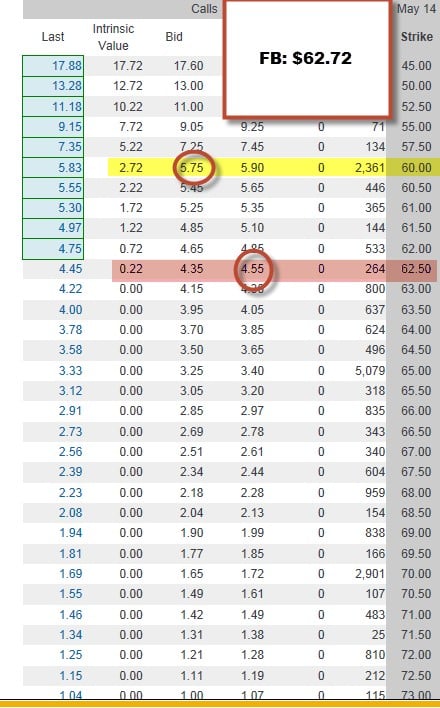
Time value of different strike prices
- The time value of the near-the-money strike $62.50 is $4.55 – $0.22 = $4.33 (cost to close)
- The time value of the in-the-money strike $60 is $5.75 – $2.72 = $3.03 (original premium generated)
- The option debit in this case would be $1.30 or $130 per contract, about 2% loss. It will actually be slightly less due to the impact of theta or time value erosion but there will be a loss. I created this chart to demonstrate the higher cost to buy back an at-the-money strike compared to the cash generated from selling an in-the-money strike and why there is no free lunch
If we thought about it and there was, in fact, a “can’t lose” strategy, who are the folks taking the other side of our trades? They can’t win! Eventually, they would wise up and such trades would no longer exist. We trade in markets, hopefully we all trade in fair market conditions. Our edge (“the BCI edge”) over everyone else is the due-diligence we execute regarding the major 3 aspects of covered call writing:
- stock selection
- option selection
- position management
This is what gives us our edge in this low-risk, but not no-risk, strategy.
With thanks to Tony.
Next live seminar:
Saturday, June 14th
8:30 – 11 AM
Costa Mesa, California (Orange County)
Click for more information and registration
Market tone:
Economic news continues to be mildly positive as it has for the past few years as recovery and expansion continues to support our stock market:
- The Conference Board’s Leading Economic Index (a composite index of ten economic indicators that typically lead overall economic activity. The index includes indicators such as housing permits, new orders for consumer goods, consumer expectations, and performance of the S&P 500 Index) rose by 0.4% in April to 101.4, as predicted. This was the third consecutive increase.
- Minutes from April’s FOMC meeting reflected discussions regarding “policy normalization” although no decisions have been determined
- The Fed described economic data as showing a pickup after the harsh winter’s slowdown
- In May, the Fed continued to reduce its bond-purchase tapering, reducing mortgage-backed securities and Treasuries by $10 billion
- According to the Commerce Department, April annualized new single-family home sales came in at 433,000, 6.4% better than March stats but 4.2% below that of April, 2013
- April median sales price of new homes came in at $275,800, Below March’s $281,700
- According to the National Association of Realtors, April existing home sales increased by 1.3% to $4.65 million, the first increase this year
- The median price of existing homes in April was $201,700, up 5.2% from April, 2013
- The median time existing homes remained on the market decreased to 48 days, less than March’s 55
- Distressed homes made up 15% of the sales down from 18% a year ago
For the week, the S&P 500 was up 1.2% for a year-to-date return of 4%
Summary:
IBD: Market in correction
BCI: Moderately bullish selling an equal number of in-the-money and out-of-the-money strikes
Wishing all our members a happy and healthy holiday weekend.
Alan and the BCI team (alan@thebluecollarinvestor.com)
www.thebluecollarinvestor.com
Alan,
I bought Cashing in on Covered Calls in 2010 and have completely switched my retirement strategy to Covered-Calls. Since August of 2013 my portfolio has averaged $225,000 and with my 8-10 stocks I have gotten returns of approximately % 5.1%/month and that doesn’t include social security for my wife and I. Only through my intro to covered calls are we able to lease a very nice condo in Cancun.
So, I owe you a great deal Alan. I spend a large amount of time trying to determine likely candidates for GOOD returns, I won’t accept less that 3% unless there in capital gain potential, I do consider ER periods and market trends. So enough for now, thanks again for your support.
John
Premium Members,
The Weekly Report for 05-23-14 has been uploaded to the Premium Member website and is available for download.
Also, be sure to check out the latest BCI Training Videos and “Ask Alan” segments. You can view them at The Blue Collar YouTube Channel. For your convenience, the BCI YouTube Channel link is:
http://www.youtube.com/user/BlueCollarInvestor
Best,
Barry and The BCI Team
Alan, I have found some stocks off the last running list to papertrade, and have now come across some more things to enquire about to you below.
1. The Beta stats on the running list when compared to yahoo-finance look a bit different sometimes. Shouldn’t we before putting on a trade checkout the latest stats off yahoo first, to know how volatile a stock could be?
2. Some of the shares of around the same value I see have different strike price gap differences, and wondered why this could be?, – is a larger gap difference best to avoid when selecting a stock?
3. Also when contemplating whether to do a CDMP strategy on any particular stock you say that I should look at the price performance comparison first. But are you trying to time your selling after a break below the “lowest low” of the recent price support level – or maybe below the “price close low point”?, – should this type of chart be in candle/bar prices or close prices?
I have some more questions to come, just to go back over the stock returns subject again. Thanks for your help.
Adrian,
My responses:
1- Different resources/vendors use different indexes and/or time frames when calculating beta. We use IBD because it uses the S&P 500 as the comparison index and a 1-year time frame.
Value Line, for example, uses the NYSE Index as the independent variable. We don’t like Yahoo for beta stats because it uses a 5-year time frame. This may be more appropriate for a longer-term investment strategy.
2- Our guideline for appropriate options to consider is a bid-ask spread of $0.30 or less and/or an open interest of 100 contracts or more.
3- Options are automatically bought back using the 20/10% guidelines detailed in my books/DVDs. This ensures retaining between 80-90% of our original option premium. In the first half of the contract I look to “hit a double” In the 2nd half I favor rolling down or CDMCP. I use the latter when the stock is significantly under-performing the overall market. A comparison chart with the S&P 500 will suffice using Perf Charts on the free site:
http://www.stockcharts.com
See the chart below.
This is a more general chart compared to using the 4 technical parameters we use in forming our stock watch lists and determining our strike price selection. As far as chart formats are concerned in this latter situation, I prefer bar charts but many of our member like candlesticks, also a useful format to use. Either one will suffice.
CLICK ON IMAGE TO ENLARGE AND USE THE BACK ARROW TO RETURN TO BLOG.
Alan
Premium members: This week’s stock report:
You will notice that this week’s reports had over 70 eligible stock candidates and over 25 eligible ETF candidates. To me, this is a confirmation of this site’s bullish outlook on the overall economy and stock market.
There are many ways to use the stock list to populate our portfolios when there are more than our typical 40 – 60 candidates. One approach could be (there are many others) to favor those stocks in bold that also have industry ranks of “A” and then eliminate any securities that may be too pricey for our portfolios (for example, AAPL is trading > $600 per share until the upcoming 7-for-1 split).
Alan
John,
When you refer to an average 5.1% per month return, what portion of this is from covered call premium?
This is an excellent return, whether from call premium or stock appreciation. What are some of the stocks?
HS
John,
Please let me add to HS’s post congratulating you on your results!
If you could say more about the stocks you are using and your strikes relative to price I am certain many of us would be grateful – Jay
John emailed his response to me:
My June candidates were obtained from my new membership in BCI and I use IBD’d latest “top 50”, International Leaders, Section leaders,etc.I just started using the “EEllman Calculator” and found a few of my early Calculations when candidate stocks where in the money” I love having it to verify my own ROO calculations plus Downside protection, Upside potential” etc. Feel free to use the info if you find it useful. I still have a lot to learn using “Exit-Strategies”. Iv’e got your book on the subject so it will be another “learning’ adventure for me.Thanks again for your early assistance.
John
BCI Community…
The email below was in response to a recent question submitted by one of our Premium Members, Ivar. We thought that the details would be interested to our wider audience…
Ivar wrote:
“A question I have is, do you think using the ichimoku chart would be helpful in picking stocks for options trading??”
Wow…this is really an interesting question. Ichimoku (cloud) charts are fairly complex and provide much of the same information that the standard BCI chart set up provides.
For example:
– The trend…
We show this using the 20 day EMA and the 100 day EMA. These are well known and tend to show much of the same information as the 9, 26, and 52 day trend lines that the ichimoku charts show. In the process of determining overall trend, you can simply draw a trend line and see much of what the cloud shows. According to the BCI methodology, we want to see the entire price bar (OHLC or candle) be above the 20 day EMA and the 20 day EMA above the 100 EMA day. This is essentially the same information that you get from the price chart being above, inside, or below the ichimoku cloud. If you want to use a faster moving average to follow your trades, you can add a faster EMA. Two off the most popular are the 5 day EMA and the 8 day EMA…although we don’t use them in the BCI system.
To be effective using the BCI methodology, you only need the 20 day and the 100 day EMAs to visualize the trends and their strength. The multiple moving averages and trend lines in the ichimoku methodology will, in my personal opinion, trend to be confusing (unless you have had detailed training in using the tool) and over-complicate the BCI system.
– Support and Resistance…
We are able to show this with simple support and resistance lines drawn either at confluence points or swing highs and swing lows. To get even more “laser-like” support and resistance, you could use Fibonacci retracements. Support and resistance levels are used by virtually every trader who uses technical analysis and you can get the same information from them as you would from the various ichimoku plots.
– Momentum…
While ichimoku tools can give you valuable information on momentum, MACD and Slow Stochastics give you the same data. When stocks are trending, MACD is a key tool in determining the strength and momentum of the trend. In a sideways market, stochastics give you important information on price position relative to being over bought or over sold when moving averages and MACD are less useful.
– Price/Trend Projection…
I’m less convinced of the accuracy of the 26 day future price projection that the ichimoku tools provide. In 1969, when the first work on ichimoku clouds were first published, there was much less volatility in the market. Online trading was still a dream and there wasn’t instantaneous information available via the internet…so the projection capabilities were useful. Today, things move so quickly and a simple projection into the future is a strategy that I personally wouldn’t use. You can get the same, if not better information from simple trend line projections, support and resistance (at known swing highs and lows), and Fibonacci projections/retracements. Although I’m a bit prejudiced, i believe that checking your trades everyday and being ready to execute one of Alan’s exit strategies are easier to execute and are more reliable than a 26 day future projection (of potential support and resistance).
OK…so where are we? I hope this response is not what my 11 year old grandson calls “TMI” (Too Much Information), but I attempted to do a simple contrast and compare between elements of the BCI methodology and my understanding of ichimoku cloud methodology. For trading covered calls, again in my personal opinion, there is no more effective methodology to trade covered calls than the BCI methodology…and I can assure you that I’ve reviewed (including reading EVERY book in print on covered calls), took training in, spent money on, and used just about every covered call system available.
If I didn’t answer your question, please get back to me and we’ll work the issue until you are comfortable.
Best,
Barry
Alan, that’s all good information you answered. I think I am still having a tendency though to use the close prices for comparing price performance, as this is what Martin Pring (TA expert) had showed example charts of in a book I have.
Going back to my 2nd question above, for if I am comparing the option returns of 2 stocks of around the same price, yet for one of the stocks the difference between each strike price may be only $1(ie. $20, $21, $22…), and the other stock has a larger maybe $5 gap difference($20, $25, $30…etc), then are you more likely to choose the stock with a smaller strike gap difference or are you not really concerned on this?(seems to me like a smaller gap has more of an advantage.) Thanks
Adrian,
Thanks for clarifying that question. Periodically, the CBOE may select up to 10 individual stocks on which option series may be listed at $1 strike price intervals where the strike price is greater than $3 to but less than $50. Additionally, no $1 strike price may be listed that is greater than $5 from the underlying stocks closing price in its primary market on the previous day, and CBOE is restricted from listing any series that would result in strike prices being $0.50 apart.
That said, $1 strikes differences will allow us to hone in on our 1-month goals more precisely but I would not use that as my main reason for stock selection but rather the quality of the fundamental, technical and common sense data associated with the underlying. All things being 100% equal between 2 stocks, I would favor the $1 strikes.
Alan
New seminar just added: Charlotte, North Carolina:
April 11, 2015
Details and link to register to follow
Alan,
I assume the biggest risk with any call, ITM ATM or OTM is a gap down leaving you with the premium but a capital loss if the gap is below even the ITM strike. If you then write the next month but at a strike still below your original purchase and the stock rises, you can roll until above original share price. It becomes a game of buying back and either rolling at same or higher strike until capital is recovered?
The name of the game then is keeping transaction costs low?
On that the best broker for Australian’s to trade in USA?
Grant.
Grant,
You are 100% correct that transaction costs must be low because of all the trading we execute.
For establishing accounts outside the US, look into the following:• Charles Schwab• Zecco• TradeMonster• Options Express• Interactive Brokers• Trade Monster2013.
As far as managing a stock that has gapped down, rolling down and writing OTM strikes is one way to manage that scenario. I ask myself…is the cash contained in that position best served in that same stock or another? It’s the cash we care about, not the stock. Selling a loser is one of the most difficult trades we have to make because that then “realizes” the loss. Sometimes that is the best move to make and put the cash in a better performer. All this is explained in the “exit strategy” sections of my books/DVDs.
Alan
Alan, I have here below the questions I promised to ask you about stock returns.
1. If you see that to buy to close and then sell to open another share is greater than your 4% maximum goal, then does this matter or are you only concerned for the initial returns only?(as in rolling down,etc)?
2. Do I need to check for stock news if the return is above 4% but also below the 6% maximum ATM strike return, or only if it is above 6%?
3. And if at the end of the month any particular stock you hold has given a total negative month return of a few percent (maybe from rolling down), then how likely is it that you will use this same stock(s) again the very next month contract?
I do have another longer question to maybe finish off this topic for me so will ask another time. Thanks
Adrian,
The reason I developed the % return guideline was because it gives us a window into the risk of the trade. The higher the implied volatility of the option (market expectation of price movement in either direction) the higher the % return. My personal sweetspot for initial return is 2-4% (a guideline, not a hard-and-fast rule) and usually avoid ATM returns > 6-7% for this reason. This guideline can be adjusted for your personal risk tolerance. For example, in my mother’s account I use ETFs and target 1-2% per month. We have members who are much more aggressive than I am…one size does not fit all.
Each month a stock is evaluated on its own merit. I may keep a stock that was a losing position the previous month if, for example, it out-performed the overall market. The question I ask is where is the cash currently obligated to this stock best situated? In the same stock or another? If there is a better candidate, move your hard-earned money to a better place. There is no change is stock evaluation from the system you are familiar with.
Alan
Alright so to confirm I can keep a loser stock if has outperformed the market and am happy holding it, and if returns are over 4% then I will most likely check for stock news, as after all the IV will be higher too. thanks
Adrian,
My personal target for initial option return is 2-4% but each investor must decide on the appropriate target for their risk tolerance and goals. In a bull market, I will be more aggressive and vice-versa.
Alan
Dear Alan Ellman,
I have a question for you.
In the Covered Call Writing strategy why does the holder of the american call option exercise immediately if the option is deep-in-the-money?
Is this is a porblem financial behavior? If it is, why? Could you kindly explain to me this concept?
Thanks,
Steven
Steven,
Options are rarely exercised early because the option holder will capture intrinsic value but lose time value Rare exceptions occur when there is a corresponding ex-dividend date prior to contract expiration. In these scenarios, early exercise may occur the day prior to the ex-date.
When a strike moves deep in-the-money, the time value component approaches zero and the time value component of the premium may disappear. This is known as the option trading at “parity” or all intrinsic value. If the option holder wants to own the underlying security, exercise will result in purchase at current market value. Only about 10% of all options are actually exercised. Most are closed prior to contract expiration.
Alan