Strike price selection can be tailored to our covered call writing and put-selling trades based on overall market assessment. In bear and volatile market conditions we favor in-the-money calls and deeper out-of-the-money puts (lower than current market value). In this article, we will evaluate defensive trades for Smith & Wesson Hldg (SWHC) as of 1/11/2016, the day after the worst week to start a stock market trading year ever in the history of US stock markets.
Options chain as of 1/11/2016

SWHC Options Chain
With SWHC trading at $22.09, the $21.00 in-the-money February 19, 2016 call generates $1.85 and the $21.00 out-of-the-money put generates $0.75. These are 6-week returns.
Next let’s turn to our calculators:
Call calculations for SWHC: Multiple tab of the Ellman Calculator
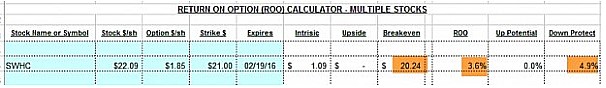
SWHC Call Calculations
The advantages of in-the-money calls in bear market environments are readily noticeable:
- A 6-week initial return of 3.6%, 31.2% annualized
- A 4.9% protection of that initial profit
- A breakeven of $20.24, $1.85 less than current market value, an 8.37% protection to breakeven
Put calculations for SWHC
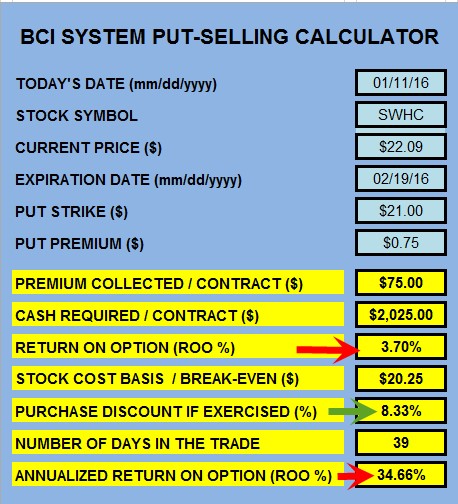
Put calculations for SWHC
The advantages of out-of-the-money puts in bear market environments are readily noticeable:
- A 6-week initial return of 3.70%, annualizing to 34.66%
- If exercised, shares are purchased at a 8.33% discount from current market value (breakeven)
Discussion
In bear and volatile market conditions we can tailor our option-selling strategies by utilizing in-the-money calls and out-of-the-money puts. Using the Ellman and BCI Put Calculators will help guide us to the most appropriate strike price selection based on our overall market assessment, chart technicals and personal risk tolerance.
***For free copies of the Basic Ellman Calculator for covered call writing and the BCI Put Calculator, click on the “Free Resources” link on the top black bar of our web pages. Or click here.
May live events
May 10th
Caesar’s Palace- Las Vegas
Two seminars plus a book signing
May 14th
Baltimore, Maryland

Stock Trader’s Expo:
Marriott Marquis Hotel in NYC
- The US Federal Reserve’s Federal Open Market Committee made no move on interest rates this week and sent mixed signals on the timing of its next hike
- The Fed removed a reference to global economic and financial conerns from the first paragraph of its statement, which some interpreted as an aggressive stance sign
- The Fed highlighted that while labor markets have continued to improve, economic activity appears to have slowed
- Japanese shares tumbled and the yen soared against major currencies as the Bank of Japan declined to add additional monetary stimulus despite slumping inflation data and a strong yen
- US gross domestic product rose just 0.5% in the first quarter, the third consecutive anemic start to a new year. Sluggish net exports and weak corporate profits were significant developments in this first quarter
- The eurozone economy grew by 1.6% year over year in the first quarter, the same rate of growth as the final quarter of 2015. Inflation failed to keep pace, however, sliding 0.2% year over year. Falling inflation will keep the pressure on the European Central Bank to seek innovative ways to spark growth and inflation
- A new plan from Saudi Arabia known as Vision 2030 calls for the floatation of a stake in Saudi Aramco, the state oil producer. Proceeds from asset sales, as well as other state-owned assets, will be held in a sovereign wealth fund worth as much as $2 trillion
- GDP growth in the United Kingdom held steady at 2.1% year over year in the first quarter but economists are concerned that growth could slow in the second quarter
THE WEEK AHEAD
- Manufacturing purchasing managers’ indices are globally released Monday, May 2nd
- Service sector PMIs are released globally on Wednesday, May 4th
- Eurozone retail sales are reported on Wednesday, May 4th
- US employment data are released on Friday, May 6th
Summary
IBD: Uptrend under pressure
GMI: 5/6- Buy signal since market close of March 2nd
BCI: Cautiously bullish, favoring out-of-the-money strikes 3-to-2. The markets finally succumbed to the mixed earnings signals (see AAPL, AMZN, FB).
WHAT THE BROAD MARKET INDICATORS (S&P 500 AND VIX) ARE TELLING US
Premium Members,
This week’s Weekly Stock Screen And Watch List has been uploaded to The Blue Collar Investor Premium Member website and is available for download in the “Reports” section. Look for the report dated 04/29/16.
Be sure to check out the latest BCI Training Videos and “Ask Alan” segments. You can view them at The Blue Collar Investor YouTube Channel. For your convenience, the link to The Blue Collar Investor YouTube Channel is:
http://www.youtube.com/user/BlueCollarInvestor
Since we are in “Earnings Season”, be sure to read Alan’s article, “Constructing Your Covered Call Portfolio During Earnings Season”. You can access it at:
https://www.thebluecollarinvestor.com/constructing-your-covered-call-portfolio-during-earnings season/
Best,
Barry and The Blue Collar Investor Team
Alan,
I am a new premium member and really excited to get started. I have some background with naked options but just starting with covered call writing. My question is regarding the significance of the last two pages of the the etf report where you list the implied volatility of all the eligible etfs. Please clarify how to use this information in our trading decisions.
Thanks,
Tim
Tim,
The reason for the IV information is that some beginners assume that all ETFs have low IV and therefore are all low-risk. That is the case in general but there are many exceptions to this rule as demonstrated in these reports. Our members can compare the IV of eligible ETFs to that of the S&P 500 and then decide which meet our personal risk-tolerance. For example, GDX and GDXJ have been great performers from our reports the past few months but have IV quadruple that of the S&P 500…appropriate for some and not so for others.
Alan
Do you know of a program where I can keep up with my monthly BCI portfolio? I use USAA as a broker but trying to keep up with the correlation between the stock and the option is difficult. It can show that I have a much larger profit than I actually have because of an option strike prices which is not taken into consideration. Have you thought about developing a program for members? It could point out automatically when we should buy back the options at 20% or 10% and indicate when the stock/option is at a point to check on an unwind situation.
Thanks,
Ken
Ken,
I have a simplistic way to keep track of my monthly positions, and it has been effective for me for several years. I use index cards. At the top, I write the month followed by individual columns for the stock, strike price, option premium, 20%, 10%, and the break even. On the back, I write additional trades when I btc, sto, roll, etc. On the front, I cross through the strike price and option premium when I implement exit strategies. I write pretty small, and this has been effective for me, as I usually have <10 positions open at a time. I will then snap a pic of my card, so that I always have it with me on my phone if I need to trade while away from home. Like I said, not very sophisticated, but it helps to not have to flip back and forth between programs and my brokerage accounts, and I always have a quick reference with me. At the end of each contract cycle, I write my net profit/loss, the percentage, and by how much I beat/under performed the DOW at the bottom.
Emily
Ken
Alan has a great spreadsheet that is easy to keep track of positions. It’s in the members area where all the downloads are called Profit and Loss Spreadsheet. You can get an accurate return based on your strike and equity price. There are lines to enter buy back if needed and the calculations go through to keep you current and accurate with your returns.
I just put in an alert through my broker to notify me when the option has dropped 20%/10%. Or you can put in an order to buy back the option automatically when it drops. I like the alert because sometimes the price drops quickly and I can buy it back cheaper than 20%
Nate
Thanks to Emily and Nate for their valuable feedback. For those not able to watch positions during the day, setting a limit order at 20% or 10% is a useful tool for us. I used it all the time when I was trading as a full-time dentist.
Alan
Alan, now that you have incorporated cash secured put selling to your strategy, I’m wondering if you do both on the same stock owned as I frequently do or is it an either or situation strategy you recommend?
Thank you
Dennis,
These are both great strategies for retail investors (more and more professionals are also incorporating these strategies into their client portfolios…I know because they’re calling me for advice) so it becomes a matter of preference and trading style. In most market conditions, I will use covered call writing with a specific emphasis on strike price selection to enhance each of my positions. In a bear market environment I like to sell cash-secured puts to either generate cash flow or enter a covered call position at a discount. I would then write an in-the-money call if I allow the put to be exercised:
https://www.thebluecollarinvestor.com/using-out-of-the-money-puts-and-in-the-money-calls-to-manage-bear-markets/
Using “either/or” or combining both are both reasonable ways of generating cash flow.
Alan
Premium Members,
The Weekly Report has been revised and uploaded to the Premium Member website. There was a typo on page 1 of the report…the ETF IFL entry was corrected to ILF. Look for the report “Weekly Stock Screen And Watch List 04/29/16-RevA.
Also, it is important to note that we use the IBD industry designations in the weekly report. The brokerage firm(s) you use may use a different industry designation. The goal of the “Industry Segment” column in the report is to help you select stocks that will give you proper portfolio diversification.
Best,
Barry and The Blue Collar Investor Team
Alan, thanks for your last week replies again. So I am sort of hinting from your answer on the “price breakouts” that you would need to only see just a ‘1 days price-close’ above resistance on strong volume for you to consider it a genuine breakout. I guess you wouldn’t do this on the same day, otherwise you may not know if price will actually close above resistance, – can you tell me if you don’t agree with that.
My other half of technical questions are here:-
1. Is it true that for every new stock to be bought during the contract and CC’s sold on them, that I should check the very latest market tone and sentiment charts at that moment first?(for me this is the A/D line chart, Put-Call ratio and VIX charts, and I only checked these at end of each week as you once said to do?)
2. For the above question, I could even go so far as to ask what about needing to check these charts just at the same moment for every single exit strategy that I were to employ on every stock I am trading with? (this certainly wouldn’t make sense because in effect I could then be checking day after day.)
3. I have been using the RSI in my analysis and even though you don’t use it, I am wondering if you think that if the RSI was higher than the S&P500 RSI figure, then it may mean that at that particular moment the stock is outperforming the S&P500?(and would also be weaker if RSI was lower?)
Could this possibly be a useful way to evaluate whether to keep any stock past expiry or not?
4. A question I have always wanted to know.
When closing out a position during the contract and then buying another new stock, then from what investments does the amount of contracts I can buy come from?(eg. if I have 5 stocks and each stock has a $5,000 value allocated to it, then do I for the new stock make $5,000 as my amount for buying it,- or do I always need to use the value amount from the stock just sold(higher or lower) to find how many contracts I can actually buy from it?
More to come on the market performances to ask about next. Thanks for your help.
Adrian,
I agree that before identifying a price breakout, we must wait past the actual day of the breakout until we identify the closing price. Price trend is only one of many screens we use in making our final investment decisions. There is no one screen we hang our hats on. Questions 1 and 2:
1-Yes, a quick review of market assessment and chart technicals before entering or exiting a position is a sensible approach especially if it is mid-week, days after our report comes out. It won’t take long.
2- Most positions will not need exit strategies unless there are extreme market conditions. We use our 20/10% guidelines to red-flag exit strategy opportunities (some members use stock price alerts). If an exit strategy is needed, a quick check of price charts makes sense but we do not need to check price charts daily.
Will get back to you on 3 and 4.
Alan
Adrian,
3- RSI can certainly be a useful tool in identifying momentum. In the BCI methodology, we use the MACD histogram and stochastic oscillator to track momentum. Like RSI, the stochastic oscillator indicates “overbought” and “oversold” scenarios. We use these in conjunction with other technical indicators, fundamental and common sense screens, overall market assessment and personal risk-tolerance when making our investment decisions. We do not hang our hats on any one indicator but rather use them all to form a mosaic of indicators to determine an overall impression of how to manage a particular position. Comparing the momentum of the S&P 500 to a particular security can be useful as well as an additional small component to our decision-making process. We can also set up comparison charts as I do for our premium members in our ETF Reports (see below from 4/20/2016). To generate comparison charts for free:
http://www.stockcharts.com
Perf Charts (on top)
Type in tickers we want to compare
4- We first determine the amount of cash available factoring in that we need a cash reserve of 2-4% for possible future exit strategy executions. Then divide price-per-share into that amount and round down the nearest 100. For example, if we have $5000.00 and share price of the new security is $23, we can buy 217 shares. We round that down to buy 200 shares and 2 contracts can then be sold.
CLICK ON IMAGE TO ENLARGE & USE THE BACK ARROW TO RETURN TO BLOG.
Alan
Friends,
I hope this fits with Alan’s blog theme:
I live in New Orleans. We had torrential rains impacting our Music Fests and PGA Tour stop over the weekend. I felt terrible for our tourists who got rained out.
When I hit squalls and fog driving around town it struck me how connected weather and the markets are metaphorically..
When caught in squalls I put the wipers on max and slowed down. I was lowering my risk like selling ITM calls on things I wanted to protect – in this case my car and me :),
Did I miss an opportunity? Probably….
I got out of the way of drivers flying past me in the deluge. I should have followed them like chasing a hot stock!
I hope they were going to a fire or a wedding. It’s rude to rush into a funeral :).
In this market patience will be rewarded. – Jay
Alan,
Are the options we use in covered call writing the same as the stock options given to employees of certain companies?
Thanks,
Ted
Ted,
The general overall framework of employee stock options (called ESOs) is similar to the “listed options” we use in that the holders of the options have the right but not the obligation to buy shares of stock at a specific price and the contracts have expiration dates. There are, however, several distinct differences between ESOs and listed options. Here are the main distinctions:
1-ESOs are not traded on exchanges
2- ESOs are not transferable…cannot be bought and sold during a trading day as are standardized options
3- ESOs are not standardized in that the number of deliverable shares can vary (as opposed to 100/contract for listed options) and do not have the typical expiration dates (3rd Friday of the month 4 PM ET for listed options). ESOs also have certain restrictions that listed options do not have.
There are other differences and those who receive ESOs from their employers should take the time to learn all the nuances of these options so they can maximize the benefits inherent in these contracts.
Alan
Premium members:
This week’s 8-page report of top-performing ETFs and analysis of ALL Select Sector Components has been uploaded to your premium site. The report also lists Top-performing ETFs with Weekly options.
For your convenience, here is the link to login to the premium site:
https://www.thebluecollarinvestor.com/member/login.php
NOT A PREMIUM MEMBER? Check out this link:
https://www.thebluecollarinvestor.com/membership.shtml
Alan and the BCI team
PNK was bought up by GLPI and then the company was div-ied up into a new PNK and GLPI. I had a call on the old pink. I now hold 85 shares of GLPI with 1 option contract on it, and “new PNK” fraction with no option. Should I sell the remnant and just play the GLPI option like it is the one I originally selected?
Laurie,
I cannot give specific financial advice in this venue but I’m happy to share some general comments:
1- Spinoffs and mergers create some unknown factors for both the underlying securities and the associated options. We do not know how the market will respond to the “new company” We do not know how option pricing and liquidity will be impacted.
2- Fundamental and technical analysis will be effected but we do not know in which direction and by how much…could be a positive or negative result.
3- To fully understand the “deal”, go to this link:
http://www.cboe.com/publish/TTStockSM/16-296.pdf
Alan
Alan,
When you talk about the 20%/10% guideline are you refering to just the TV component of the premium, or the entire premium price?
Kind regards,
Brett
Brett,
The percentage applies to the entire premium. This works because of fact that in-the-money strikes have higher Deltas than at-the-money and out-of-the-money strikes and premium will decline faster for strikes with intrinsic value.
Alan
I’m very new at this, and would like to learn all I can before going further with covered calls.
Unfortunately, I wrote a very ill-advised one a few months ago. The strike price was $4 below what I paid, and the expiry date was close to a year out. Although I would like to find a means of exit, it would cost too much to buy the call back. The premium I had received was about $600, and now the cost would be $1,800. I’m just hoping the buyer won’t exercise their right to buy the stock in January.
But I guess we learn the best lessons from our mistakes!
With much appreciation…
Catherine
Catherine,
If the strike is in-the-money even by $0.01, it will be exercised after expiration unless you buy back the option. Early exercise is rare but possible especially when there are dividends distributed. The amount you will “lose” when buying back an option is the time value only. Here’s an example:
Stock price: $52
Sell $50 call for $4
Stock price now $60
Cost to close: $10.20
Share maximum value: $50 due to option obligation
Buying back option: Debit of $10.20
Share value now moves up to $60 from $50
Net loss: $0.20 per share; not $10.20
Alan
Catherine,
In Alan’s example the position actually made $1.80 in option premium. So my question is do you not want the position taken from you because you want to keep the shares long term or is it because you think you will lose money?
If it’s to keep the position look at Alan’s example and you can see that since you don’t have the obligation to sell the shares at the strike after buy back your shares are worth the higher current price. And you really aren’t down in the position. The problem comes since you have so much time to expiration the shares could go back down by January then you don’t have the buffer of the option premium.
My guess is that you don’t mind getting called away since you wrote an ITM option, as long as you don’t lose money. In this case you actually made money sooner without having to wait till expiration. In this situation use the mid contract unwind exit strategy. Use Alan’s example above and just sell the shares and the profit is yours to keep. Since you don’t have an obligation at the strike you can now sell the shares at the higher current price. If you do the calculation you will find that the difference between the strike sold and the current price is more than a $1,200 gain. Anything over $1,200 in Stock appreciation is your profit to keep. The $1,200 comes from 1,800 to buy back minus the 600 received to sell.
Nate