Covered call writers and put-sellers know that options should never be sold when there is an upcoming earnings report prior to contract expiration. This is one of the most important rules in the BCI methodology. The reason is the result of the inherent risk we are subject to from a disappointing report. Since we know the projected dates of these quarterly reports, avoiding them can easily be accomplished. However, from time to time, a company will pre-announce information regarding an upcoming report and this unexpected news can impact our stock and option positions. In this article, an overview of pre-announcements will be presented along with the practical impact they have on retail investors.
What is an earnings pre-announcement?
It is a statement about earnings that are materially different from the expectation of financial analysts or from prior guidance given by the company.
Why will a company pre-announce?
Regulatory concerns
The Securities and Exchange Commission (SEC) exists to protect investors and therefore requires companies to provide meaningful and timely information to the public.
Legal concerns
Shareholders can sue a company for having known certain information and not disclosed it. One such scenario could be a company being aware of an earning’s “miss” well before the report date.
Window dressing
When a company takes an initial price hit prior to earnings season, it may not look as bad when it reports along with its industry competitors weeks later.
Concern for its investors
By being candid and providing timely information regarding a mid-course correction, investors can take action sooner rather than later and this can reflect positively on a company that is then likely to get punished to a much lesser extent, if at all.
When should a company pre-announce?
There is no legal requirement here but an unwritten rule is that when a company knows that it will miss by 5% or more, it should pre-announce within a few weeks to a few days of the end of a quarter.
Image risks of not pre-announcing
The qualifications of management come into question as does the accuracy of the board’s forecasts. The trust factor also can be impacted and ultimately share value will be punished to a greater extent than had the company pre-announced. Companies have learned that a poor quarter should not be exacerbated by ignoring the obligation to pre-announce.
How to manage pre-announcements: Practical application
All this great information presented thus far and now I’ve got nothing! Well, I’ve got a little but it’s not impressive. That’s because we never know when a pre-announcement will be made public. Most of the time there will be no pre-announcement but it is not incredibly rare. It will pop up from time-to-time. Some ideas:
1- If we used only stocks that reported earnings in the previous contract month and a long way from the next quarterly report, pre-announcements will be virtually a non-issue. The problem with this approach is how limiting our database of eligible candidates will be. Our rigorous screening process already has a limiting effect.
2- Use exchange-traded funds (ETFs) instead of individual stocks. There are pros and cons to ETFs but earnings and possible pre-announcements will become a non-issue.
3- Ignore the possibility of pre-announcements and deal with bad news if and when it comes. We do so by mastering the third required skill of option-selling…position management. This is the world I reside in as it relates to pre-announcements but feel free to reside in worlds one or two if they more closely align with your trading style.
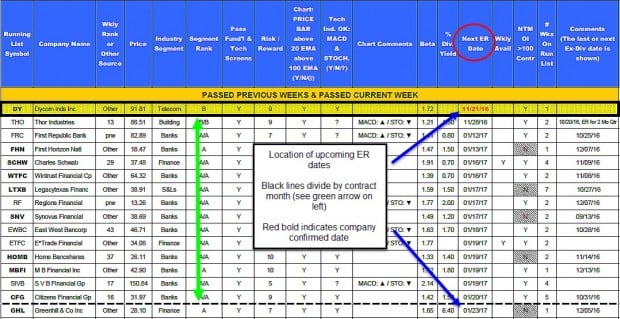
Location of actual ER dates in our premium stock reports
Discussion
Earnings pre-announcements can be the source of unexpected bad news. Unlike the actual earnings report dates, we do not know about these events in advance. We should have a plan in place to deal with these events if and when they occur. For detailed information on position management strategies in my last two covered call writing books:
- Complete Encyclopedia for Covered Call Writing- Classic version: Pages 245 – 302
- Complete Encyclopedia for Covered Call Writing- Volume 2: Pages 243 – 272
Holiday discount now in effect- Use promo code HOLIDAY10
Login here and use promo code holiday10 to get a 10% discount on our store items through December 15th for holiday delivery
Upcoming live events
December 1, 2016
Blue Hour webinar 3: Registration now open and free to premium members…only a few seats remain available.
Thursday at 9 PM ET
Premium members login and scroll down on the left side to the Blue Hour registration link. General members can purchase a seat at the Blue Collar store (https://www.thebluecollarinvestor.com/store/) and use promo code “Holiday10” for a 10% discount.
Event information and registration can be accessed at these links.
December 6, 2016
Options Industry Council Webinar Summit
Tuesday afternoon…1:30 PM ET:
Those who register but cannot make the live event will be sent a link to the presentation recording.
February 27, 2017
Stock Trader’s Expo
Marriott Marquis Hotel, NYC
1:30 PM ET
Exhibit hall Booth 208 (February 26th – 28th) … come say hi to the BCI team
Market tone
Global stocks rose this week on tax reduction expectations in the aftermath of the US presidential election. Strong US economic data suggest the economy is gaining strength even before any additional fiscal stimulus. Volatility, as measured by the Chicago Board Options Exchange Volatility Index (VIX), fell to 12.34 this week from 13.2 a week ago. Oil prices rose in anticipation of a deal to cut production at next week’s OPEC meeting in Vienna. This week’s reports and international news of importance:
- A series of stronger economic data points were released this week, confirming the case for a hike in policy rates from the US Federal Reserve at its December meeting
- Durable goods orders increased by 4.8% in October
- There was a nine-and-a-half year high in existing home sales
- There was also an increase in the manufacturing purchasing managers’ index
- On Tuesday, the four major US equity indices, the Dow Jones Industrial Average, the S&P 500 Index, the Nasdaq Composite Index and the Russell 2000® Index, all set record highs. The last time all four indices ended in record territory was December 31, 1999
- President-elect Donald Trump announced his priorities for his first day in office in a video this week. At the top of the list was a vow to withdraw from the Trans-Pacific Partnership, a multilateral trade deal. Also on the list are looser restrictions on energy production, reductions in government red tape, enforcement action against visa overstayers and a measure that would bar executive branch members from lobbying within five years of leaving their jobs
- The United Kingdom’s economy has yet to show significant ill effects from Brexit. Its economy grew 0.5% in the 3rd quarter versus the prior quarter, boosted by net trade and business and consumer spending. The falling pound has been an important stabilizing factor for the UK economy in the wake of the June vote to leave the European Union
- Japanese core consumer prices fell for the eighth straight month in October, declining 0.4% year over year. The price trend illustrates how difficult it has been for the Bank of Japan to lift the economy out of its deflationary spiral
- Turkey’s central bank was forced to raise its benchmark one-week interest rate 0.50% to 8% on Thursday to defend the plunging lira. So far, the rate hike – the first in almost three years –has not affected the currency’s decline
THE WEEK AHEAD
- ECB president Mario Draghi testifies before European Parliament committees on Monday, November 28th
- US Q3 preliminary GDP is released on Tuesday, November 29th
- The eurozone consumer price index is reported on Wednesday, November 30th
- Global manufacturing purchasing managers’ indices are reported on Thursday, December 1st
- The US releases its November employment report on Friday, December 2nd
For the week, the S&P 500 rose by 1.44% for a year-to-date return of +8.29%.
Summary
IBD: Market in confirmed uptrend
GMI: 6/6- Buy signal since market close of November 10, 2016
BCI: I am currently fully invested and have an equal number of in-the-money and out-of-the-money strikes.
WHAT THE BROAD MARKET INDICATORS (S&P 500 AND VIX) ARE TELLING US
The 6-month charts point to a bullish outlook. In the past six months the S&P 500 was up 6% while the VIX declined by10%.
_____________________________________________________
Wishing you the best in investing,
Alan (alan@thebluecollarinvestor.com)


Alan,
I’ve been writing calls on AGN for many months. However, I did not exit during the recent earnings report (very unfavorable) and the stock lost 20% of its value. But, LT outlook looks positive. Now, I’m in a quandary: do I wait until the stock rebounds before writing calls (afraid stock could be called away, i.e., incur possible loss), write OTM calls or sell position?
Dave
Dave,
First we need to establish our goals. If your outlook is bullish and you want to generate monthly (or weekly) cash flow while still allowing for share appreciation, then write out-of-the-money calls which will generate your intended target initial returns (eg 2-4%/month are mine). If you plan to hold this stock through future earnings reports, you can write Weeklys the contract month of the report and skip the week of the report with the goal of benefiting from a favorable report. Of course, here you are risking another negative surprise.
When a stock has declined significantly for any reason, we ask ourselves where is the remaining cash invested currently in AGN best placed? Still with AGN or with another security? There is nothing wrong with taking a loss to avoid an even greater loss. Once again, if bullish on the stock, writing OTM calls and rolling if ITM at expiration is the tract to follow.
It is instructive to re-evaluate the reasons why a position was initially entered and ask ourselves if those parameters are still in place. If yes…OTM calls. If no, we move on to another security.
There can be many reasons to like a stock and technical analysis is not the only reason. However, this stock has a pretty rough-looking technical chart as shown in the screenshot below. The short term moving average (blue line) has been trading under the longer-term EMA (red line) most of the year except briefly in August. From a technical perspective, when the 20-day EMA dropped below the 100-day EMA in late August, many technicians would use that indicator as an exit point (see red arrows), closing the position at $250.00 per share.
The yellow field shows the price decline in the past year from $310.00 to the current $192.00. To remain with a security like this we owe it to ourselves to identify non-emotional reasons to do so. I have to remind myself all the time that it’s the cash, not the stock, that’s important to us.
CLICK ON IMAGE TO ENLARGE & USE THE BACK ARROW TO RETURN TO BLOG
Alan
What percentage of positions do you roll or close?
KD
KD,
First, let me give you a general market response:
A common claim is that 90% of options expire worthless, and that therefore it is better to be a seller of options than a buyer of options (it actually is but not for that reason). This claim misstates a statistic published by the Chicago Board Options Exchange (CBOE), which is that only 10% of option contracts are exercised.
But just because only 10% are exercised does not mean the other 90% expire worthless. Instead, according to the CBOE, between 55% and 60% of options contracts are closed out prior to expiration. In other words, a seller who sold-to-open a contract will, on average, buy-to-close it 55-60% of the time, rather than holding the contract through to expiration.
So if 10% of options contracts end up being exercised, and 55-60% get closed out before expiration, that leaves only 30-35% of contracts that actually expire worthless.
For me, a higher percentage of my sold contracts are exercised prior to earnings season where I will “allow” assignment to remove stocks about to report. This means a lower percentage will be closed. I don’t have precise stats for you but it could be as much as a 20% swing in both categories prior to earnings season.
Alan
Alan,
I appreciate you sharing over the course of the last few articles you are back to fully invested. You must have had some shopping to do after the election :)?
I did as well. And, man, no one got the market direction post-Trump more wrong than I did – I was sure we would see a sell off. But, I guess those who were short did worse. Being in cash never crushed anyone.
Since then in addition to buying some positions I have had success selling cash secured puts on others closing them for gains as stocks go up then rolling into new ones on the next down tick.
This will not go on forever. A profit taking broader market pullback has to be imminent even if short lived – the perfect chance to sell more puts! And though everyone says a quarter point rate increase is “baked in” we will not know until we know.
My suggestion, then, for those with cash to put back in is don’t forget OTM cash secured puts in your haste to chase stocks in the fervor of this rally! You might get paid to wait and then get back in at a better cost basis on a portion of your cash. – Jay
Thanks Jay…always appreciate your perspective. For new members, here is a link to an article I published on this topic:
https://www.thebluecollarinvestor.com/using-put-selling-to-enter-a-covered-call-trade-at-a-discount/
Alan
And, likewise Alan, I always appreciate how you and Barry follow up so promptly with all of us here!
While my Saints were beating the Rams – too little too late I am afraid – I was crunching options numbers for the week ahead. There is just not much premium out there.
Some great stock ideas on the list this week but with option OI blocked out. So I will need a little “help” from the market selling off a bit before I sell new puts.
It is tough to draw support and resistance lines out of thin air on a market that has never been this high. It will be of interest to see if S&P 2200 support holds through mid December and the Fed or becomes resistance again. – Jay
Alan,
I have read your books, and recently joined your site. Last week I bought 200s of THO and sold one ITM and one OTM call. So far so good. However, when I bought the stock, the BCI report said that earnings were due at the end of December, so I was safe for this contract period. This made sense, as the last earnings report was released at the end of September. Now that ER has been moved up to this Monday. I’m not sure why they would release a report only 2 months later, but that’s what’s going to happen. I have a $4 gain on the stock, and obviously the premiums for both calls have gone up. If I unwind the position now, it’ll be a guaranteed loss. I bought the shares for 86.62. Sold one dec16 85 call for 4.20 and one dec16 90 call for 2.16.
Any recommendations?
Mike
Mike,
The situation is far from bleak. Let’s breakdown the math using current stats:
Stock price: $90.67
If no action is taken we are at risk of a negative earnings
surprise.
If we close both legs:
Share profit = 200 x $4.05 = $810.00
Option credit = $636.00
Total credit = $1446.00
Cost-to-close options = $750.00 + $420.00 = $1170.00
Net credit if closing = $276.00 (less commissions)
1 week return = $276.00/$17,324.00 (cost of 200 shares) = +1.6%
After studying the earnings history of THO, Barry and I noted that the last report was 4 months from the previous one…just making up for lost time.
Alan
Got out of the position this morning when THO was up 2%. Made 2.7% total when all was said and done. Thanks for the help! Will be interesting to see how the ER goes today after the bell.
Mike
Wonderful !!!
Roni 🙂
Premium Members,
This week’s Weekly Stock Screen And Watch List has been uploaded to The Blue Collar Investor Premium Member site and is available for download in the “Reports” section. Look for the report dated 11/25/16.
Also, be sure to check out the latest BCI Training Videos and “Ask Alan” segments. You can view them at The Blue Collar YouTube Channel. For your convenience, the link to the BCI YouTube Channel is:
http://www.youtube.com/user/BlueCollarInvestor
Since we are in Earnings Season, be sure to read Alan’s article,
“Constructing Your Covered Call Portfolio During Earnings Season”. You can access it at:
https://www.thebluecollarinvestor.com/constructing-your-covered-call-portfolio-during-earnings-season/
Best,
Barry and The BCI Team
Alan,
Why not sell a deep ITM call (strike price at support level) just before the earnings release to capture the extra option premium from high vol?
Thanks for your guidance,
Dave
Dave,
Your rationale is very good…use deep ITM calls to offer protection against a disappointing report. As you stated in your question, implied volatility will be higher-than-normal prior to a report. If we were evaluating tis strategy, those are the pros.
On the other side of the coin:
1- Deep ITM calls have less time value premium than near-the-money calls
2- In a bull market environment or even in normal market conditions we are removing share appreciation as a potential benefit if we employed a different (non-reporting) security.
3- Are we willing to take the risk of an extreme disappointment (and for a modest return if all goes well)?
Let’s take a current example. THO is reporting after the bell tomorrow. The current price is $90.67 and support from the 20-day EMA is at $84.37 (see screenshot below-red arrows). Looking at the current options chain (could change a bit tomorrow morning) the $85.00 deep ITM calls has a spread of $7 – $7.50. Let’s say we can negotiate a bid price of $7.15. This will represent an initial return of 1.7% as long as THO remains above $85.00. The chart also shows that a previous report in early March resulted in a price decline of $5/share (blue arrow-brown field).
The questions we must resolve are:
1- Does the upside justify the downside
2- How much risk are we willing to incur
3- Are there better opportunities to generate higher returns perhaps using OTM calls in the current market environment
Evaluating both perspectives is an extremely useful exercise and will allow us to determine the best path to take. I avoid earnings reports, period. My way isn’t the only way.
CLICK ON IMAGE TO ENLARGE & USE THE BACK ARROW TO RETURN TO BLOG
Alan
See below for correct chart…thanks to Peter…Alan
Alan:
The chart you have shown for THO shows a price increase of $5 in early March after earnings. Am I missing something?
Peter
Peter,
Thanks. The wrong chart was uploaded. See below a $5 decline post ER.
CLICK ON IMAGE TO ENLARGE & USE THE BACK ARROW TO RETURN TO BLOG
Alan
To all,
This week we are having more and more very interesting posts. Wow !!!!!
The trades are exactly what happens to us all the time, and Alan’s responses are excelent lessons, that I will follow when in trouble.
Dave, I did the same mistake in some of my past trades, and I still have the scars. But I learned to avoid ernings reports like the pest..
Mike, same thing happened to me once. You are lucky to be able to exit with a small gain, don’t miss the chance.
Roni
Alan,
You are a fan of the IBD stocks for use in your system. I also belong to IBD, and will use their service to buy their recommended stocks on breakouts from particular chart patterns. A part of my Sunday routine is to go through their stock lists and pick out the stocks that are close to proper buy points – as defined by William O’Neil / IBD. The stocks that are listed as “extended” on their charts are avoided, as in the IBD system, it is felt there is a greater chance of pullback.
Do you use the concepts of “proper buy point” and “extended from proper buy points” in your stock selection from which to sell calls?
Thanks
Mike
Mike,
In the BCI methodology, we use 2 of IBD screens:
1- The IBD 50: I have had impressive success selling options with this group of stocks over the years. Along with our own database of over 3000 stocks, my team screens the IBD 50 looking for option-selling candidates for our members.
2- IBD SmartSelect screen: To be eligible, a stock must have the top-performance grade in all 6 categories (green)
Now, these are only 2 of our screens and we do use technical analysis as well (along with several other screens) which relates to your question. Now here is the important point that, in my humble opinion, must be factored in relating to the IBD buy/sell point analysis (and others as well)…the analysis is not for covered call writing or selling cash-secured puts. It is for longer-term “buy-and-hold” stock ownership strategies. If we want to add a stock to our stock-only longer-term portfolio and that stock’s price chart is in an “over-extended” position, we may want to wait until the price declines. Or we can set a limit order at a lower price or even use our option skill set and sell an out-of-the-money cash-secured put to either buy the stock at a lower price point or get paid not to buy it.
However, when we write a covered call we are taking on a 1-month obligation (1-week for some members). Different rules apply. Also, since we avoid earnings reports, we are rarely in a specific stock for more than 2 contract months anyway. Let’s look at a real-life example, NVDA, a stock which has been on our Premium Stock List for more than 4 months. The chart below highlights the Stochastic Oscillator which identifies overbought (over-extended) and oversold scenarios. The yellow highlighted field shows “overextended (above the 80%) situations, which to some would red flag a “buy” situation. The red arrows show multiple situations when the indicator was overbought. Yet the blue arrow on top shows a continuous price acceleration. I have seen stock prices reside in this overbought range for many months at a time.
What makes the BCI screening process unique is that it is geared specifically to short-term option-selling. The value of a screening process is directly related to the specific strategy being employed. It can be useful for one strategy and not so much for another.
CLICK ON IMAGE TO ENLARGE & USE THE BACK ARROW TO RETURN TO BLOG
Alan
Alan.
I hope you are well. I have a question. When you set up a portfolio does the number of stocks or etfs relate to the size of the portfolio? For example if you use five premium stocks with $50000, would you use the same five if the portfolio is $300000? Would you use more stocks which may spread the risk but increase management and would you possibly further diversify with stocks, etfs, and blue chips as per your blog?
Thanks Richie
Richie,
Our guidelines are for a minimum of 5 stocks in 5 different industries. Less when using exchange-traded funds because those securities come diversified to begin with. When we have the flexibility of buying more stocks because of a larger cash value to invest, we should do so. The more diversification, the better. The caveat here is that we want to make the process both user-friendly and time efficient so we don’t want to end up with an unmanageable situation.
The number of securities appropriate for an investor will vary. For me, I hold between 15-25 positions each month and sell between 50-100 contracts per month. That is my comfort level now. When I first started, the number and amount I was comfortable managing was much smaller.
Start out with a smaller number of securities, properly diversified. Then add to that amount until you find the level right for you.
Alan
Premium Members:
We are going to be adding the IBD “Big Cap 20” list to the stocks that we screen each week starting with the report on 12/2/16. This list will help meet the needs of our Premium Members who are interested in large cap growth stocks which generally have less volatility than stocks on the IBD 50 as well as stocks that, in most cases, pay a dividend These stocks will be identified as “BC20” in the third column of the weekly report (“Weekly Rank or Other Source”). A special thanks to Jay who requested this enhancement over the last year.
Best,
Barry and The Blue Collar Investor Team
Thanks Barry,
I think this will be yet another great enhancement to the Premium Site. These stocks should be a nice add, along with those on the Blue Chip list, for longer term holds or “poor man’s covered call” long option stock replacement choices.
Not that they are immune to earnings report sensitivity, no stock is! They are simply higher volume and liquidity name brand entities. One can switch to weeklies and skip being covered during earnings and ex-div dates for lower portfolio turnover to compliment the more volatile smaller stocks we turn over more frequently. – Jay
Alan,
I am sure glad that i Subscribed to your service i spend a lot of time studying your books and working with your material. The stock on your list are right on. I am also paper trading with my Thinnkorswim program. I am waiting for the market to make up its mind which way it is going to start making serious trades.
The purpose of my writing to you is to ask if you and your team are fully invested at this time. I prefer buying stock when they have pulled back versus surged up on the Trump election. what’s your take on the current situation?
Thank you
Ray
Ray,
I am currently fully invested but hedging slightly by selling 50% of my options in-the-money. One advantage of undertaking 1-month obligations is that we can re-assess our market views each month.
Alan
Alan, Thanks again for your reply help from all those calculations asked to you via email. And I think my main interruption understanding those trades was with the MCU, where I needed to figure-out what the ‘extra cash available’ value came to,- and so realized it as $1,069.
So again if that End portfolio = $16,423, and that final return = 2.84% too (going by my formulas), then it looks more certain that I will finally be able to correct all my past years papertrades.
*There are still plenty of other questions I have, but I first have another long one I just wanted to share with you below:-
– So I am not too sure how far I should be taking my searching for new stocks to use, from the expiry premium reports.
As an example, I had 2 ETF’s I rolled out but needed 3 stocks. Off the report I came with 26 Bold/Mixed stocks, and of those there were only 7 stocks that had enough liquidity and return on the strike I selected for me to then go over. So then of these 7 and finally hours later I narrowed it down to 3, – which means I found the 5 that I was wanted.
But my question is should I be using a bigger list of stocks so to perhaps be left with more than 7 stocks to choose from, or have I just overdone it too far?(I’m just not sure how far I should take it, but want like the minimum amount of stocks so I am not otherwise spending too much time on it?)
Thanks
Adrian,
To fund a portfolio of 5 securities, the stock and ETF reports should be more than sufficient. I use between 15 – 25 securities and sell 50 -100 contracts each month and I use the very same reports available to our premium members, nothing more. Keep in mind that we also started publishing quarterly Blue Chip reports that increases the number of available securities.
Feel free to expand the database but it certainly is not essential.
Alan
Premium members:
This week’s 8-page report of top-performing ETFs and analysis of ALL Select Sector Components has been uploaded to your premium site. The report also lists Top-performing ETFs with Weekly options.
For your convenience, here is the link to login to the premium site:
https://www.thebluecollarinvestor.com/member/login.php
NOT A PREMIUM MEMBER? Check out this link:
https://www.thebluecollarinvestor.com/membership.shtml
Alan and the BCI team
Tomorrow’s Webinar:
Tomorrow’s (December 1st 9 PM ET) webinar has just a few seats remaining (as of this typing). Premium members login to the member site and scroll down below the 10% discount link to register. Bring children, grandchildren…anyone not near retirement).
General members:
https://www.thebluecollarinvestor.com/the-blue-hour-3/
Alan and the BCI team
Running list stocks in the news: NVDA:
Nvidia Corp., a specialty semiconductor graphics company, announced a stellar earnings report on November 10th with record quarterly revenue of $2 billion, up 54% from a year ago and an increase of 40% from the previous quarter. Earnings -per-share rose by 89% from a year ago. As a result, EPS projection for the current year rose by 33% and for the following year went up by 43.5%.
Our premium report shows this stock has earned its way onto our eligible list for the past 17 weeks and has an impressive technical chart as shown below. Our stock report notes that this is the #1 ranked stock on the IBD 50, is located in the “Chips” industry, currently ranked “A”, has a Scouter Rating of “7”, a beta of 1.27, a % dividend yield of 0.60, has Weekly options, has adequate open interest, the next projected earnings release date is 2/9/2017 and the latest ex-dividend date was on 11/23/2016.
CLICK ON IMAGE TO ENLARGE & USE THE BACK ARROW TO RETURN TO BLOG
Alan
Well, Alan, while I am certain your stock highlights will never become the equivalent of “The Sports Illustrated” or “Wheeties Box” curses how ironic you should post this ahead of the big news driven sell off today in NVDA and the Chips Sector :)?
Jim Cramer made mention of NVDA today:
While market rotation is indeed healthy — selling a good tech company like Nvidia (NVDA) for a not-as-good Deere, for example — at some point there needs to be balance, Cramer said.
This type of divergence can’t last forever, he explained. It would be nice for the Nasdaq to stabilize and perform better to boost investors’ overall confidence, Cramer reasoned.
Every news dip like this that does not shake the fundamental story creates opportunity. The January monthly cash secured puts at $80 strike look good on NVDA now. – Jay
Hi Jay,
I see your point.
NVDA has been very good to me since I started monthly buy writes last March, making about aprox. 3% each month except in earnings seasons.
Today I have a position with respective 12/16 covered calls at 95.00 strike, (88.00 break even), and hoping it will recover before expiration.
If NVDA drops again today, I am planing to buy back the calls at 10% of premium received, and watch it very carefully trying to hit a double, or liqudating before the loss gets over 3%.
Cheers – Roni
Thanks Roni,
Congrats on your months of great trading on NVDA!
Buy back of deteriorated sold options is always a good idea. We made money. All we have remaining is risk. – Jay
Yes Jay,
you are right, there is always risk when we buy back and wait to hit a double, but the 20/10% of the premium we leave on the table is relatively small, and gives us some edge to make the bet worthwhile.
The real test for me is the non emotional decision to liquidate before the loss is more than 3%.
Roni
Hey Roni,
There is a new blog thread but if you cycle back to read this what I was trying to say is I love the 20%/10% buy back rule because you have reached at least 80% of your profit potential on that particular option trade so there is no point taking the risk of price reversal just to nurse that last 20% out of it.
Then when the position is free again you can look at selling it, hitting a double, rolling down, rolling out, etc..
Seems to me if you have been selling calls on NVDA since March your effective cost basis on it has to be way below this little hiccup this week and you have many things you can do with your shares besides selling them if you still like the fundamental story.
You still have two weeks of December expiry to hit your double, you could even roll out at the same 95 strike for January and get $2.20 a share, more as NVDA recovers and still have some upside run room. The resistance seems to be at 95 so you could go out to 100 strike for January, give resistance room to break and have 13% up side with 1% cash flow on that option.
So it is a fun stock to trade in a volatile sector and I wish I had picked up on it earlier. Since I have no position I like the idea of starting with OTM cash secured puts just below support when NVDA has down days and put values rise. I like the $80 level for that unless we get a further breakdown that brings in lower strikes with simiilar reurn and about -20 delta which I like for sold puts.. – Jay
Tonight’s webinar reminder:
Starting time is 9 PM ET…will last approximately 1 hour…presentation + Q&A.
Alan and the BCI team