Mastering option calculations is an essential skill needed to attain the very highest covered call writing returns. Although the Ellman Calculator will do most of the heavy lifting for us, understanding the reasons behind these calculations and when and how to apply them, will make us all more skilled investors.
Recently a BCI member sent me a hypothetical trade that involved two of our exit strategy choices: rolling down and the mid-contract unwind (MCU) exit strategy. Let me first define:
Definitions
Rolling down: Closing out options at one strike and simultaneously opening another at a lower strike price.
Mid-contract unwind exit strategy (MCU): Closing an entire covered call position mid-contract when the time value of the premium approaches zero and using the cash to establish a second income stream in the same month with a new position.
The hypothetical trade
- Buy shares at $74.00
- Sell-to-open (STO) $74.00 call (at-the-money- ATM) at $2.50
- Buyback $74.00 calls at $0.50 (meeting the 20% guideline)
- Rolldown to $70.00 strike at $2.00
- Price accelerates to $78.00
- Buyback $70.00calls at $8.20
The questions
– Now what I want to know is that if I am correct here in knowing that the intrinsic value of the last option (#6) is $8.00, and the time value is $0.20 (for the $8.20 option), then am I to also take the MCU share gain as $8? (from $70 to $78)
– It can’t surely be from $75 up to $78 can it, as time value would be too large? (or am I wrong?)
– Is my calculation correct for a -$4.20 total options loss, and +$8 for price gain to = +$3.80 profit?
The math
Based on this example, I see the confusion commonly experienced by covered call writers. There are 2 sets of calculations that should be viewed individually, but frequently are combined which then may cloud the situation. The first calculation relates to whether to pull the trigger on the MCU strategy or not. The 2nd is the overall profit (loss) results. Let’s address the MCU first:
1- We base our decision whether to completely close our short option and long stock positions based on the current market value of our shares which was rolled down to $70.00. We do not base it on some value in the past ($74.00). The time value component to accomplish this is $0.20 because the shares can be sold for $78.00 and gain $8.00 in share value at this point in time. If we can generate more than $20/$7000 or .29% (a fraction of 1%) by re-investing that newly-acquired cash, we should pull the trigger on the MCU strategy. Next, let’s review the final results:
2- Final results: we don’t know final results at this point in time because the cash generated from instituting the MCU strategy hasn’t been re-invested so the final chapter hasn’t been written. However, to date you have an options debit of:
$2.50 + ($2.00 – $0.50) – $8.20 = (-) $4.20 (sum of all options credits and debits)
You have a share unrealized credit of $78.00 – $74.00 = + $4.00 (bought at $74.00 and currently valued at $78.00)
Total unrealized loss to date = (-) $0.20
This tabulates to a cost-to-close of a fraction of 1% as shown in the figure below using the “Unwind Now” tab of the Elite version of The Ellman Calculator (free to premium members):
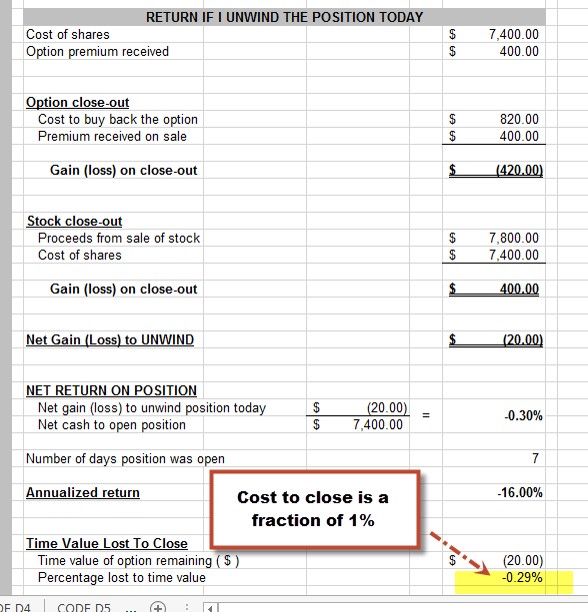
Mid-Contract Unwind Exit Strategy Calculations
Now, it’s up to us to write the final chapter that month and re-invest the $7800.00/contract to turn that small loss into a gain. We turn to our watch list of eligible stocks, find an appropriate price per share and check options chains. The information is fed into the Ellman Calculator as we make our final decisions. This is a great example of how being active can, in many cases, allow us to manage our positions to mitigate losses, turn losses into gains and enhance gains.
Discussion
Understanding covered call writing calculations is an important skill we must master. This includes comprehending the differences between exit strategy and final calculation results.
*** For more information on covered call writing exit strategies, see the exit strategy chapters in the following books:
The Complete Encyclopedia for Covered Call Writing- Classic edition
The Complete Encyclopedia for Covered Call Writing- Volume 2
Your generous testimonials
Over the years, the BCI community has been incredibly gracious by sending our BCI team email testimonials sharing stories as to what our educational content has meant to their families. Moving forward, we have decided to share some of these testimonials in our blog articles. We will never use a last name unless given permission:
Posted comment:
Alan is a natural at this stuff, and perhaps the top communicator in the industry for new or seasoned retail investors. Learn & listen! % get on the CEO path to controlling your own money…
Terry D.
Upcoming event
July 22: Chicago Traders Expo
1:30 – 2:15
Hyatt Regency McCormick Place
***********************************************************************************************************************
Market tone data is now located on page 1 of our premium member stock reports.
***********************************************************************************************************************


Alan,
On your Weekly Watch list, what do you do when the cycle
isn’t a normal 4 or 5 weeks?
Say that you place your CC Trade 2 weeks before the
3rd Friday of each month. You will not have a normal 4
or 5 week cycle. How do you approach this as far as
adjustments go?
Thanks,
Tony
Tony,
Position management in the final 2 weeks of a Monthly contract remains the same as those described in my books/DVDs under the title “exit strategies in the latter half of a (Monthly) contract”
For example, the guideline to close the short call is 10%, not 20%. Another example is that we would favor “rolling down” over looking to “hit a double”
These guidelines factor in the impact that Theta has on our option premiums.
Alan
Alan,
Do you ever deliberately lose on the option side to make up on the ‘bought up value of buying to close a position at a loss’ and selling a covered call at a higher strike to pick up on the rise in stock price?
Or should we always go for a win on the option side first?
I want to be on the conservative side but not sure if this violates that.
Thanks,
Jack
Jack,
Yes, there are scenarios when it makes financial sense to take a loss on the option side to enhance our overall returns. Both our long stock and short option positions must be factored into our management decisions.
Two of our exit strategies that frequently highlights this principle are the “mid-contract unwind” exit strategy and “rolling out-and-up”
Alan
Dear Alan,
You have opened my eyes and added a new dimension. One of the topics that concerns me is how to write covered calls in an upmarket in a position in which you hold a sizable loss but is recovering. It is mostly buy and write. If the stock has a high beta it can be challenging . I would love to hear or see you do a video on this subject.
Thank you so much,
Alison
Allison,
You are describing a stock on which you currently have a bullish assessment. The original purchase price is irrelevant whether it is substantially higher or lower than the current market price. In these situations, we favor out-of-the-money strikes and the specific strike is based on initial time-value return goals.
Let’s say a stock is trading at $50.00 and we are looking for a 2% initial 1-month time-value return. We check the near-the–money strikes above $50..00 with a premium near $1.00 and that is the strike we select.
This issue is detailed extensively in my books & DVDs as well as in our “Ask Alan” videos (available to premium members) and in our Blue Hour webinars (available to premium members). There are also free articles archived on our website.
The key takeaway is that our current investment decisions should not be based on stats from the past (original purchase price) and all emotions should be removed (“I’m going to get my money back no matter how long it takes”).
Now, let’s make some money.
Alan
Hi Alan,
Do you have a video on how to handle positions if they have gapped up in the midst of the trade you are in?
Appreciate your help!
Kurt
Kurt
Alan will probably respond regarding the video.
What you describe is a gap up of a stock (time value approaches zero) in the middle of a cycle. The strategy to use is a Mid-Contract Unwind in the Complete Encyclopedia Vol. 1 Page 264-271 and is the Unwind Now tab of the Elite Calculator (calculates cost to close in $ and %).
You can also find answers in the Blog by searching for MCU or Mid-Contract Unwind.
When I see a stock gap up and it is in the middle of a cycle (no later than Wednesday of third week of a 4 week cycle (4th for a 5 week cycle), and I know that there are opportunities with a new CC security (at least >(1% + MCU Closing loss) ROO), I setup an open combination order to exit that CC option trade (see stock, buy back option). The limit price I use will guarantee the maximum % loss I will lose on the exit order. I cancel the exit order near the end of the 3rd week if it has not filled.
Mario
Kurt,
Mario’s response says it all.
As far as videos that address this (positive) matter, the exit strategy section of our streaming covered call writing DVD program and our exit strategy DVD program detail this issue with real-life examples. There are also multiple videos available in our library of “Ask Alan” videos that explain how to manage stocks that have moved much higher than the original price when the trade was entered. Here are a few examples:
Ask Alan # 35
Ask Alan # 61
Ask Alan # 104
Just login to our member site and scroll down on the left side to access these videos. There are a lot more.
Alan
Alan,
I work to follow the BCI methodology as I feel your procedures bring more success than my past experiences using “broker methods”.
It seems the market has been all over the place this and last year, and I feel unsure how to actually gauge just how profitable my trading has been.
By looking at a year ago and calculating the increase today vs. back then, will this give a true picture of my portfolio’s successes?
As we stick with BCI procedures, I feel the need for bigger increases yet I am responsible to assure the IRA’s we invest with will grow in a safe manner.
Is “aggressively conservative” an investing philosophy?
Thanks for being part of our financial world!
Jim & Donna
Hi Jim & Donna,
Welcome to our blog community.
First, I am not answering for Alan and I know it was to him you posed your questions.
As a fellow investor I thought I would share my views with you.
In my opinion, the measure of one’s portfolio’s performance versus the S&P 500 is the most simple and easiest way.This is the benchmark most fund managers and individual investors use. This measurement is called alpha.
Let’s say your one year return is 12% when the S&P returned 10%. On the surface this is very good. You did 20% better than the benchmark. Your alpha is 2.
However, there is a kicker. That is, “what was the risk that your portfolio took to get that extra 2%, or 20% increase?” I think we can all agree that there can be a difference between a 2% gain at low risk and a 2% gain at high risk. Obviously the dollars are the same but I hope you get my point. The risk measurement is called beta. The lower the beta the safer your portfolio is.
Measuring the extra risk (and have no doubt, to beat the S&P you have to take more risk) can be difficult to very, very difficult.
In a static portfolio of stocks, or stocks and bonds, the beta can be measured. It’s a fairly complicated formula but it can be determined.
The more you trade, either stocks or stocks and options, the more difficult it is to measure beta. Unless you have the algorithms as the large trading firms have it is almost impossible.
Fortunately we have statistical and historical data that gives us some very good guidelines. The BCI has incorporated these guidelines, actually principles, into it’s methodology.
Basically, selling covered calls on fundamentally sound, technically strong, industry diversified, low beta equities in portfolio appropriate amounts is about as safe as you can get. In my opinion the only safer way is to use appropriate ETFs as listed on the ETF Report. With equities you have to avoid earnings reports, and be aware of ex-dividend dates, plus the occasional “Black Swan” event. With ETFs you only have to be aware of the ex-dividend dates.
I am sure this probably didn’t answer your question but I tried.:)
Again, welcome,
Hoyt
Hoyt,
Thanks for your post. I now understand what the expression “seeking alpha” means.
Marsha
Jim and Donna,
Let me add this to Hoyt’s outstanding response:
When we write a covered call, we are lowering our cost-basis. This is why we should “beat” the market (S&P 500) every year, many years substantially.
The term “aggressively conservative” definitely applies to many investors but not all. I would leave the word “conservative” as it applies to option-selling and then “fill-in-the-blank” for the adjective. It could be “aggressively” conservative or “ultra” conservative or anywhere in between. I lean to the former in my accounts and to the latter in my mother’s account.
Alan
Jim & Donna,
Your question:
“By looking at a year ago and calculating the increase today vs. back then, will this give a true picture of my portfolio’s successes?”
My opinion: Sure, you are perfectly correct.
When you trade in the stock market, you are investing aggressively, period.
The BCI methodology is the most conservative roadmap for long term consistent gains at the lowest risk.
Roni
Premium Members,
This week’s Weekly Stock Screen And Watch List has been uploaded to The Blue Collar Investor premium member site and is available for download in the “Reports” section. Look for the report dated 07/12/19.
Also, be sure to check out the latest BCI Training Videos and “Ask Alan” segments. You can view them at The Blue Collar YouTube Channel. For your convenience, the link to the BCI YouTube Channel is:
http://www.youtube.com/user/BlueCollarInvestor
Best,
Barry and The Blue Collar Investor Team
Alan,
Having trouble with following scenario:
Bought gdx 6/10 22.37
Sold call July 24 for .24
Price on 7/11 was 26.21
Can buy call back at par 2.21 (no time value left)
Want to keep this etf
Rolling out to August 24 strike only nets 2.39. Seems anemic and too ITM to make much sense and rolling out and up obviously even worse premiums but want to keep stock so not sure best course.
Thx!
Doug
Doug,
At this point in time (pre-market on Monday), we have an impressively successful trade… an unrealized 8.4% 1-month maximum return. It’s too late in the contract to consider the “mid-contract unwind” exit strategy so rolling the option or taking no action (at this time) are open for consideration.
If we use the “What Now” tab of the Ellman Calculator, we see a miniscule return of 0.75% (with no upside) for rolling out but decent returns for rolling out-and-up (2.38% – 5.67%). See the screenshot below.
We have 5 trading days to re-evaluate our bullish assessment of this underlying and then make final decisions closer to 4 PM on expiration Friday whether to roll the option.
Keep in mind that even if early exercise occurs (extremely rare), we can always re-purchase the stock.
Keep up the good work.
CLICK ON IMAGE TO ENLARGE & USE THE BACK ARROW TO RETURN TO BLOG.
Alan
Alan;
If you are in a covered call position with the stock price declining so that you are losing on the stock side, when would you consider doing a stock repair strategy as opposed to simply selling the position?
Regards;
Terry
Terry,
There are other choices. The stock repair strategy is most appropriate for stock-only portfolios where stocks may be held for the long-term. Of course, if we close the short call in our covered call trade, we can integrate the stock repair strategy but then our goal of constant cash generation pretty much ends.
A better approach would be to roll down or look to “hit a double” If share price movement is significantly under-performing the overall market or egregious news comes out, it is time to “get out of Dodge” and use the cash to enter a new trade with a better performer.
Alan
Alan,
1) I have kept scrupulous records and believe if when July 19th comes if I sold all my stock or let it be assigned then I could tell from (share appreciation + option premiums) – (costs + share losses) what I actually have in my account that is a profit.
2) But say I roll-out or roll-out and up all of my 5 stocks and my share appreciation is ahead a total of $1.00 each stock a share and my total premiums are 250.00 then what is my actual profit?
I going to give you my perception on this process at the end of the July contract for 6 options I’ve sold.
Thanks,
Jack
Jack,
The best way to analyze the success of these trades (not for tax purposes) is to calculate prior to rolling the in-the-money strikes. The formula in these circumstances is:
[(option credits – option debits, if any) + (original strike – share price when initial trade was entered)]
To get a % return, divide this number by the initial cost of the shares.
For example:
Buy BCI at $48.00
Sell the $50.00 call for $1.50
Near expiration (before rolling), BCI is trading vat $52.00
The formula for the 1-month return:
[($1.50) + ($50.00 – $48.00)] = $3.50
% return = $3.50/$48.00 = 7.,29%
Now, the rolling process should be factored in to the next contract month. Use the “What Now” tab of the Ellman Calculator to assess if this makes financial sense and meets our goals.
Alan
Premium members:
This week’s 8-page report of top-performing ETFs and analysis of ALL Select Sector Components has been uploaded to your premium site. The report also lists Top-performing ETFs with Weekly options as well as the implied volatility of all eligible candidates.
New members check out the video user guide located above the recent reports.
For your convenience, here is the link to login to the premium site:
https://www.thebluecollarinvestor.com/member/login.php
NOT A PREMIUM MEMBER? Check out this link:
https://www.thebluecollarinvestor.com/membership.shtml
Alan and the BCI team
Hey friends,
To the extent seasonality plays any part in your trading IWM started it’s rollover last week, SPY and QQQ typically roll over at the end of this week and the market is lousy through August.
But I am sure Trump and Powell have a vested interest in not letting anything serious happen 🙂 Still, it is usually wise to over write closer to the money for August. – Jay
Jay;
Thanks for your insight on IWM. I am currently overwriting IWM.
Best;
Terry
Thanks Terry,
I am just a hobbyist like the rest of us but I suspect any index overwrites for August cash flow NTM will turn out to be income. IWM is the most suspect of the bunch. If you own GLD and over write it give it wider room or don’t cover it at all. My two cents. – Jay
Trading Experiences – 7/18/19
Jack,
Section 1 – Account Value view:
I noticed your comment you keep a scrupulous history of your trades. I do so as well and benefit greatly at times for that effort, including end of year times that you have to take care of..
Regarding keeping track of your trading gain/loss and return and general account performance here are my comments from different viewpoints of reference. I have noticed several questions on this topic recently, so here is my two cents.
Account Value (Big picture view):
In my case I have in my accounts at Etrade (IRA, Individual) and Fidelity (IRA, Individual, Joint Trust Account). I keep track on paper on a weekly weekend basis the account values of each account and the grand total of 4 IRA, Individual accounts and separately the Joint Trust account. You can then compare the account values with S&P 50 or other reference.
At the end of the year, at least for my case, I make adjustments for RMD paid out from my IRAs on 12/15, any Reinvestments of the RMD put back into my Individual accounts, and then the Tax paid out to Uncle Sam.
The account values you read from your brokerage includes the closing amounts to buy back or close the current options you own and includes the cash balance in your account, which includes dividend (from Securities) and interest/dividends earned deposited to your cash account.. Brokerages might slightly differ in the closing value of an option (ASK value, Average) but the general value give you a picture of your account value.
I am able to get a real time value of this total of the 4 accounts by creating a Watch List at Fidelity. The watch list is very powerful since it allows Stocks, Options, and Cash Balance to be recorded. To keep the cash balances of each account separate, I use separate Money Market accounts (FDRXX, FDLXX, FMOXX, etc) with a Price of 1 and adjust the number of shares to reflect the cash balance. It’s a workaround that works. For options, you can the option with a quantity of -1 for a short call. The grand results is a real time value of your account value. If you compare the results to your brokerages account value it is close enough. If you owned stocks only, the number is exact.
Anyone can open up a Fidelity account and use the online watch list with not need to trade at Fidelity. Note: A nice thing also if you use Fidelity’s active trade Pro for trading is you can see the same watch list from that program as well.
Section 2 – Individual Stock/Option view:
On a daily trading basis, I have found that once you determine at the initial trade your Return Cost Basis (a constant), keeping track of the of the Break-Even point (BEP) is a good way of easily calculating your current G/L (Gain/Loss) and %Return for your position at any point in time, including the effects of dividends received, and any options trades that occur.
Using the BEP, I believe it is a simpler way of making the calculations for your current Gain/Loss per share and %Return for a position. You can also evaluate trading decisions at exit or roll points, or your even to calculate the effects of an overwrite on stock position you own.
Note: I actually use Price/share values after commissions in my calculations.
For the example Alan discussed the BEP is (Stock BCI $48.00 – $1.50 (Option Sale)= 46.50. The Return cost basis for the OTM Covered Call is $48.00 (Purchase price of stock) (For an ITM covered call, the RCB is the strike value). At this point, looking at Expiration Friday and other points in time:
A. Exp. Friday, RCB=48, BEP=46.50: Static return – No change in stock price, option is worthless, position status is G/L (48) = Gain is 48- 46.50 = 1.50/share %G/L = 1.50 / 48 = 3.13%.
B. Exp Friday: Option gets assigned: G/L(50)=50-46.50=3.5 /share %G/L = 3.5 / 48 = 7.29%.
** Notice for (B) that if the stock price rises above 50, and you let your option be assigned, the covered call behaves like an In-the-money option and the calculation stays identical to the above at strike 50 with a %G/L of 7.29%.
C. Exp Friday: Price at other prices below the strike: Price 49 – Option Worthless ($0) If Liquidate: G/L(49)=49-46.50=2.5/share %G/L=5.21%. Price at 45 (below BEP): G/L(45)=45-46.50= -1.50. %GL=-1.50/48 = -3.13%.
D. Dividend received: 0.80/share, New BEP = 46.5-.8=45.7. Use this for new G/L, %G/L calculations in the future.
RollOut Case:
E-1. Exp Friday-Roll Out to Strike 50: Price at 50.5. BTC (Strike 50) = 0.1, STO (Strike 50) @ 2.50. Using the new BEP in (D) above. New BEP = 45.7+0.1-2.5=43.3. G/L (50) if assigned at 50 = 50-43.3= 6.7/share, %G/L= 6.7/48 = 14.0%
E-2. Exp Friday – RollOut and Up to Strike 51: Price at 50.5. BTC (Strike 50) = 0.1, STO (Strike 51) @ 1.90. New BEP = 45.7+0.1- 1.90 = 43.9, G/L(51) if assigned at 51 = 51 -43.9=7.1/share %G/L=7.1/48 = 15.0%
Comparing E-1 and E-2 you can make a decision on whether you take the conservative Rollout at 14.0% or the bullish Roll out and UP at 15.0%.
Alternative method for evaluation of a Roll out: Roll out page 280+ of Encyclopedia and for Rout and Up Page 290 and 402-405. Also presents What Now Tab of Ellman Calculator.
F. Another case that comes up is a Gap up of your position and you want to exit (unwind) your position completely and try another security for another income stream in the current cycle (up to Week 3/4 or Week 4/5).
Looking at the assigned position (B-above), RCB=48, BEP=46.50, the results are G/L (50) = $3.50 / share or $350 / contract, %G/L = 7.29%
Ideally, assuming you can buy back the option with a time value of 0, the BTC option value is 10 (Intrinsic only).
Your credit combination order to Sell the stock and close the option is 60-10=50. (No matter what the price of the stock is, the credit limit order is 50, the strike of your position.)
Your new BEP with the stock at 60 is 46.50 + 10 = 56.50 (debit to your cash balance, so you add the option value). Your G/L is now G/L(60)=60-56.50 = 3.5 / share. So there is no loss at exit if you can buy back with a time value of 0.
I usually set a guaranteed loss combination credit limit order so my time value is limited to 0.1% of the strike. With Strike $50.00, that is $0.05. As I have discussed in this blog before, to guarantee that the credit limit to set is Strike – Time value. The credit limit to set is 50 -.05 = 49.95. Note that if your commission is $5-$10 and you have only one contract, that is another $0.05 – 0.10 loss or net 0.2% to 0.3% at exit time.
With a credit limit of 49.95, the stock at 60, the Option value (BTC) is 60-49.95= 10.05. BEP = 46.50 + 10.05= 56.55. G/L (60) =60-56.55 = 3.45 / share. %G/L = 3.45 / 48 = 7.18% Change in loss: 7.29% – 7.18% = 0.11%, which meets essentially the goal of 0.1% loss if Credit Limit order is set to 49.95. Note: if one uses a Return Cost Basis = 50, for the above %G/L calculations, the difference is exactly 0.1%.
Hope the above is helpful in some way to you and others.
Mario