Covered call writing and put-selling candidates must pass a series of fundamental, technical and common-sense screens in order to be considered eligible for our portfolios. In early January 2017, one of our members, Jim W, asked about using Ford Motor Corp. (F), a stock that does not pass our BCI screens but has several positive features:
- Analyst recommendations (I don’t put much weight into this one)
- Improving chart technicals (okay you have my attention now)
- News of an impending 1-time special cash dividend during the first quarter, 2017
Improving chart technicals

Ford Chart: 1/5/2017
A 1-year chart clearly demonstrates an encouraging price pattern. There was a bullish moving average crossover (red arrow) in December and bullish signals coming from the MACD histogram, stochastic oscillator with volume confirmation (green circles). Now, of note are the major whipsaws present in this chart indicating a stock that may offer high premium due to the inherent implied volatility (IV) displayed in this chart pattern. To confirm, we simply can look at our option premiums but as an additional exercise I went to a free site: www.ivolatility.com to check the IV of F compared to the overall market:
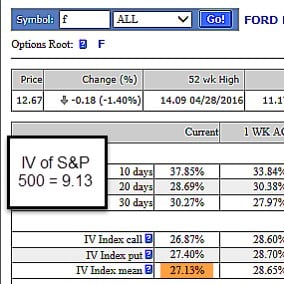
Implied Volatility of Ford Stock in January, 2017
Sure enough, we see the IV of Ford is triple (27.13%) that of the S&P 500 (9.13%) and therefore we would expect significant returns for near-the-money strikes despite being a blue-chip company. Let’s see if we can generate at least a 2% initial return using this underlying. Turning to the 1-month options chain, our expectations are confirmed:
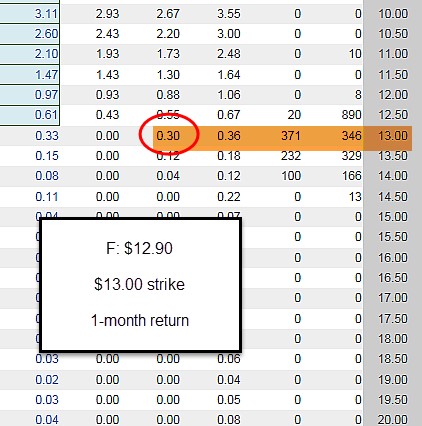
Ford: 1-Month Options Chain
With Ford trading at $12.90, the near-the-money $13.00 call generated a 2.3%, 1-month return ($0.30/$12.90) and a 3.1% total return if Ford moves up to the $13.00 strike price buy expiration.
Special 1-time cash dividend
In January 2017, Ford did announce an additional dividend to be distributed in March, 2017:

Certainly, a company that has additional cash to distribute to its shareholders represents an asset when deciding if the stock is a viable candidate.
What happened since early January?
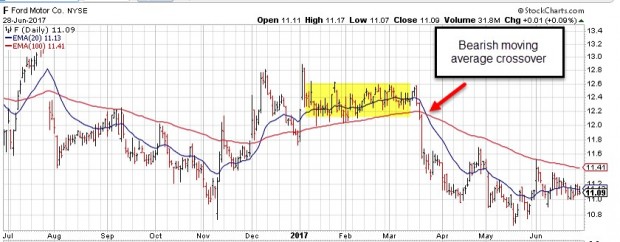
Ford: Bearish Moving Average Crossover
For the next 2 months Ford price shows a consolidating chart pattern (moving sideways as shown in the yellow field) until mid-March when there was a bearish moving average crossover (red arrow) when our bullish assessment would have been revisited.
Discussion
Generally, we should remain structured to our system of self-investing. If we were to veer slightly and make exceptions from time-to-time, we would look to a stock that has improved technically and shows fundamental strength as did Ford in the form of a special 1-time cash dividend. Such candidates would also have to generate the premiums that meet our goals.
Next live event
American Association of Individual Investors
Washington DC Chapter
Saturday July 15, 2017
9 AM – 12:00 PM
“Using Stock Options to Buy Stocks at a Discount and to Bring Portfolio Returns to Higher Levels”
Co-presenter: Dr. Eric Wish, Finance Professor, University of Maryland
Market tone
Global stocks declined slightly this week partially due to central bank discussions of scaling back monetary stimulus. Oil prices rebounded, rising to $45.40 from $42.65 last Friday. Volatility, as measured by the Chicago Board Options Exchange Volatility Index, ticked up to 11.18 from 10.6. This week’s economic and international news of importance:
- Markets turned volatile this week after a series of hawkish comments from central bankers suggesting that the era of ultra-loose monetary policy may be nearing its end
- European Central Bank president Mario Draghi’s speech on Tuesday to a gathering of central bankers in Portugal suggested that the ECB is considering curbing its asset-buying program
- Bank of England governor Mark Carney said the Monetary Policy Committee will debate a rate move in the next few months
- US Federal Reserve chair Janet Yellen voiced concerns that equity and other asset valuations are on the rich side, which suggests that financial stability worries could keep the Fed on a tightening path, despite easing US inflation pressures
- Inflation pressures remain as the eurozone reported on Friday that consumer prices rose only 1.3% in June versus a year ago, down from 1.4% in May. That’s well below the ECB’s near-2% target
- US economic growth in the 1st quarter was revised higher for a second time on Thursday. Gross domestic product expanded at a 1.4% annual rate, the US Bureau of Economic Analysis reported
- The eurozone economic sentiment indicator (ESI) jumped to a nearly 10-year high of 111.1 in June from 109.2 in May. The ESI reached 111.8 in August 2007, just before the global financial crisis began to intensify
- A stolen police helicopter strafed and dropped grenades on Venezuela’s Supreme Court and Interior Ministry headquarters this week as protests against President Nicolas Maduro intensified. The political tumult comes against the backdrop of a deepening economic crisis fueled by runaway inflation, food shortages and falling government revenues stemming from weak oil prices
THE WEEK AHEAD
Mon, July 3rd
· Eurozone Manufacturing PMI, unemployment report
· United States Markit manufacturing PMI
· US ISM report
Tue, July 4th
· US Independence Day
Wed, July 5th
· Eurozone Retail sales, Markit services PMI
· United States FOMC minutes
Thu, July 6th
· Eurozone ECB minutes
Fri, July 7th
· United Kingdom Industrial production
· US June employment report
For the week, the S&P 500 moved lower by 0.61% for a year-to-date return of 8.24%.
Summary
IBD: Uptrend under pressure
GMI: 3/6- Buy signal since market close of April 21, 2017
BCI: I am fully invested in the stock portion of my portfolio currently holding an equal number of in-the-money and out-of-the-money strikes. I’m keeping an eye on the recent increase in volatility in the tech sector and so I remain cautious with 50% in-the-money strikes.
WHAT THE BROAD MARKET INDICATORS (S&P 500 AND VIX) ARE TELLING US
The 6-month charts point to a neutral to slightly bullish outlook. In the past six months, the S&P 500 was up 8% while the VIX (11.18) moved down by 20%.
Much success to all,
Alan and the BCI team
Alan
If you were to pick one link for stock news etc, what would that be? Thanks and have a great weekend.
Luis
Luis,
An excellent free site for stock news:
http://www.finviz.com
Most broker platforms also offer this resource.
Alan
Luis,
Most brokers offer stock news but it is often limited in scope. A long time ago I used to subscribe to real time streaming Dow Jones News for $39.95 a month (~ $480 a year).
I don’t know if they still offer it or if the minimum account size is still the same but Scottrade offered it for free if you opened an account with $500. Parking $500 saved me $480 a year. Check it out.
Alan,
I just finished the book and gave you a great and much deserved review. I do have a few points or questions for you:
1. With LEAPS I find the problem is the bid-ask spread. When looking at LEAPS to substitute for the stock I’ve been looking for LEAPS with deltas > 90. I figure I need this, to best mimic the function of owning the stock. But the bid-ask is normally pretty big. When I’m determining my potential ROO, I deduct half of the bid-ask spread (from the numerator). I find this normally sinks the possibility of the trade. Is this a good approach, or am I missing something?
2. In addition to potentially a better return I find the LEAPS allow me to consider stocks that would normally be too expensive for me.
3. In the cash secured Put section you mention that you can get in trouble if the stock really tanks and your short put gets exercised. I understand what you’re saying about the lag in assignment and being able to sell your shares, but I believe if I just buy the put or another put I could mitigate the problems of the time delay. Is this a legit strategy?
Anyhow thanks for your great book and have wonderful of 4th of July.
Best regards,
Chris
Chris,
When using a LEAP as a Stock Replacement Strategy, split the B/A and if that would be an acceptable fill, place the order. If someone else is willing to transact at that price, you’ll get a fill. If not, c’est la vie.
As you noted, the LEAP provides you with the opportunity to consider stocks that would normally be too expensive for you. The time premium is the drawback and it may be quite significant for a stock whose options have a high implied volatility (compare MSFT with NVDA).
A hidden risk with this strategy which many are unaware of is the asset depletion that occurs with dividends and its affect on options. Dividends inflate put premiums and deflate call premiums. When a stock goes ex-div, the exchanges reduce share price by the amount of the dividend which the share owner receives back on the Pay Date. The holder of a deep ITM high delta call LEAP does not receive the dividend and his intrinsic value drops on the ex-div date. So the presence of dividends gives the appearance of a low cost LEAP but the total amount of dividends must be made up in addition to the time premium paid in order to break even by expiration. I’m not suggesting that one should not utilize this strategy only that one should be aware of the pros and cons.
If using this call LEAP as a surrogate for stock in a covered call (CC), it becomes a diagonal spread and hopefully, repeated writing opportunities will lower you cost basis. Your ROI will be higher than a CC and your maximum risk will be lower. Make sure to write strikes that are higher than you LEAP’s cost basis so that you do not lock in a loss if assigned.
As for getting into trouble from selling a cash secured put, that’s the risk of this strategy and the equivalent covered call. You should not be concerned with “lag in assignment”. If the loss exceeds your risk tolerance, buying another put to mitigate this problem only complicates the issue and results in unnecessary B/A loss and commissions. Just BTC your short put in the option market and take your loss. Now if you want a lower risk, a lower margin requirement and a higher ROI, consider PMCCs, collars and spreads as the opening position.
Hey S, hope you do not mind me referring to you that way rather than type out your login :)?
I am fluent in cc’s and CSP’s but only got interested in LEAPS this year after Alan’s Blue Hour on PMCC’s. Your reply to Chris was excellent, thank you!
I am looking to take a small handful of Blue Chips off the Monthly report and buy some LEAPS as stock replacements since the cost is obviously lower. I have been paper trading a SPY Jan 19 LEAP I bought at the 1.00 Delta a few months ago. At the same time I bought the 2x SPY ETF SSO in the paper account for comparison. They run neck and neck.
Obviously there is not a 2x ETF on, say Boeing (BA) but using it as a discussion example it has a good fundamental story and is on the Blue Chip list. Using Sunday afternoon pricing and balancing high Delta with reasonable open interest and bid ask spread I picked the Jan 2019 $140 call splitting the spread and can likely buy it tomorrow for $60 pending market changes. BA closed at $197.75. I would be buying $57.75 worth of intrinsic value and only $2.25 of time value with an .87 Delta meaning the option should go up and down 87 cents on the dollar with BA.
I would buy it as a pure stock replacement strategy for now controlling 300 shares for less cost than buying 100. Once it got some appreciation under it I may start over writing it OTM.
From your experience does that trade give you any concerns – other than the normal market risk that BA stock takes an unexpected decline and I feel it with almost 3 to 1 leverage? Thanks, – Jay
Jay, I’ve been called far worse than S. It’s no problem :->)
I would be concerned about the leverage but you acknowledged understanding that and it being your intention from the get go, so no problem there. I would attempt to find the highest strike price that you could with the lowest amount of time premium that you would be willing to pay, in order to further limit the risk. For example, your Jan 2019 $140 call at $60 would be $2.25 of TP. As an example, if I could get the Jan 2019 $150 call at $50.50 with $2.75 of TP (made up a numbers), that might intrigue me more. That extra 50 cents of TP with $10 less risk would be a good trade off. For a buy and hold position, 50 cents won’t mean much in a year and a half. But that’s just fine tuning. I see nothing wrong with your position as you presented it.
If you were looking for a defined range of P&L, say 5-10-15 % around current price, I’d look at a shorter term vertical spread. They could probably be had for the same time premium you are looking at. For example, a 10% vertical would be a 180c/220c and its cost should be about 20 pts. Perhaps Jan 2018. Risk 20 to make 20.
Many people would say that with he spread you could lose 100% of you investment if BA dropped. True that but only down to $180. Below that, you’d have dry powder while the share owner took the additional beating. With a huge collapse, you could buy in much lower. The odds of that happening are slim but BA lost 2/3 of its share price in 2008. It can happen.
There is no best option strategy. You want to utilize the one that offers a P&L risk graph that best fits your outlook (hope?) for the underlying. I’m risk averse so spreads and collars suit me and that’s why I mention them. If you want to bang around some numbers, hit me back.
S.
Extremely helpful, thanks!
I trade debit and credit verticals all the time, usually about 6 weeks out. When premiums are higher I sell condors also. But I will look at your suggestion for a longer horizon on BA and wider spread than I usually use ($5 – $10).
I don’t consider any of that “investing”. That is all “trading” off to the side with smaller allocations. I consider covered calls, cash secured puts and LEAPS part of investing along with core holdings. Thanks for the idea of moving up the call tables to find a better trade off between cost and time premium on LEAP stock replacements. I do like higher Delta and that falls off as you move up so it really is a balancing act.
Since I live in New Orleans I beg forgiveness for having a bit of River Boat Gambler in me :)! I own some simple ITM calls on SPY, QQQ, GDX and even a niche stock I like called IRBT for the month ahead. Tiny positions to keep it fun!
I may just buy some ITM debit spreads out to August on Blue Chips off the list and treat them as trades taking profits when I can and not spend much. I already have enough money in the market. Thanks for getting my wheels turning better :)! – Jay
Jay,
Yah, higher premium levels are good for selling verticals and condors but that also means a higher implied volatility and delta and therefore a higher probability of reaching the strikes involved. As always, they give you something but there’s no free lunch :->)
Credit and debit spreads are interchangeable. Assuming fair value, the advantage of one over the other leans towards whether you are bullish or bearish and having no closing costs if successful. When they have the same terms, covered calls and cash secured puts are equivalent. A vertical is the same as either one just with an OTM leg to lay off some of the risk and is then equivalent to a collar. If any of this isn’t clear, ask for details. All can be used for trading or investing – it’s the application of the strategy that determines that.
Time decay is non linear. For ATM options, it’s loosely related to the square root of the time remaining (see a pricing formula) but loses this relationship as IV changes and and/or if the options are OTM. What does that mean? If you’re buying options, go out longer to diminish theta (time decay). If you’re selling premium, consider shorter term in order to maximize the decay rate. The sweet spot tends to be 30-45 days out.
Some of these option strategies receive some really weird names. I learned of one earlier this year (the name not the concept) called the Jade Lizard. It’s 3 legs of an Iron Condor. You sell a short put on a stock you are willing to own and above that, you sell a bearish call spread whose maximum loss is no more than the credit received for the short put. If it works out, you keep two premiums. If it drops, your purchase price is lower than had you just shorted the put. And if totally wrong to the upside, you make/lose nothing. I doubt I’d have any use for it unless I legged in after a beneficial move on one side and even that’s doubtful. Worth knowing what you can do but why not just call it a 3 legged condor??
Glad that you find the convo beneficial.
Thanks S,
For friends here that don’t live and breath this stuff like we do if you think a Jade Lizard is a piece of jewelry, an Iron Condor is a heavy metal rock band and a Butterfly is an overgrown insect you are well adjusted and in a good place :)!
I manage my significant other’s 401k. She has given me one directive: stay fully invested. She still works and has no time to fuss with it. I sector rotate her account and I am beating the hell out of my IRA accounts where I have Level 3 Options clearance and can do anything I want. Problem is I have kept high cash balances in a bull market and gotten spanked for that month after month.
My point in mentioning this is investing does not need to be complicated. Often the simpler you make it the better you do. In the past 52 week rolling one year period SPY is up over 15%. If you had tagged a .5% OTM covered call onto it every month it would be up 21%. I am not up anywhere near that despite all the market knowledge I might feign to have. – Jay
Jay;
You mentioned a sector rotation strategy. If you don’t mind sharing:
– What sectors do you like now?
– How do you time your rotation in and out of the sectors?
Thanks;
Terry
Hey Terry,
There is nothing about sector rotation or market timing that is easy. The market is always right. All we can ever be is wrong trying to guess it’s next move! That is why I like SPY. It will sector rotate for you. All you need to do is hold it and write OTM calls monthly for incremental yield!
I don’t get the sense money is leaving the market. It’s just moving around.
Barry’s lists will pick up on that. Look for sector concentration week over week in the stocks.
For the US sectors I like the free tools available on Morningstar.
Recently I have done well with Defense, Aerospace, Financials, Industrials, Social Media and Semi Conductors.
I have been clumsy in this mini “Tech Wreck” owning a pile that has spent too much time in the Barber Shop :). But I used weakness as a chance to sell cash secured puts on QQQ. My hunch is Tech is where the growth and innovation is. I have a hard time imagining it being down longer term. But for now l am trying to “catch a falling knife” and that rarely turns out well :).
I have been building positions in XBI and XLV on down days against my better judgment. I think the health care debate will be a stalemate and those sectors will be fine.
To answer the last part of your kind question I use a combination of technicals and seat of my pants intuition. Please wish me luck with that :)! – Jay
Chris,
Thank you for your generous Amazon testimonial. It means a lot to me.
My responses:
1. To use this strategy, we must look to highly liquid stocks like the Blue Chips, for example. Below is a screenshot of the current option chain for MSFT and the January 2019 LEAPS. With MSFT trading at $68.93 to get to a 90 Delta, we probably are looking at the $50 or $52.50 strike. When calculating the potential cost of the LEAPS, I would find the mark (mid-point) and then move slightly in favor of the market-maker. For example, for the $50 strike, I may put in a limit order to buy at $20.15. This represents a time value cost of $1.22 which must be measured against the short call premium to determine the efficacy of using this strike. This Poor Man’s Covered Call (PMCC) strategy is one of the topics covered in an upcoming book we are working on relating to covered call writing alternative strategies.
2. The PMCC has its pros and cons as do all strategies. Lower cost basis is one of the advantages.
3. Yes, the BCI guideline is to buy back the put when share value declines > 3% below the strike sold. If the decline is market, rather than company, related and early in the contract, some investors may decide to wait for a bounce back before taking action and this is where lack of immediate exercise notification may be an issue.
CLICK ON IMAGE TO ENLARGE & USE THE BACK ARROW TO RETURN TO BLOG
Happy holiday to you and the BCI community.
Alan
Doing some Saturday reading it seems interesting the DOW, S&P and Small Caps are all above their 50 day moving average despite the roller coaster last week. Only QQQ has dipped below it’s.
I am not a political person. I am a market junkie :)! But to the extent Trump continues to unravel, Tweets irrational things and his approval ratings tank I get concerned about market impact.
I am still long July and long Tech uncovered. We shall see. -Jay
Any other fave indicators of market health Jay? I keep close tabs on RUT, DJT and JNK, all of which look bullish currently.
Justin, I suspect like you do I have a long list of things I watch and like the ones you point out most are bullish so I hope QQQ recovers it’s 50 day and rejoins the group and not vice versa!
I think a greater concern than the Trump circus show is what will be the impact of the House’s AHCA bill if enacted into law . It l proposes over a trillion dollars in Medicaid and SNAP cuts. In addition, anywhere from 15-25 million people will lose their health insurance. It’s unlikely that the Senate will rubber stamp that but putting politics aside, if it became law, that would result in a significant decrease in consumer spending and from what I’ve read, GDP could take a 1 to 1.5 pct hit. Can this tepid economy and therefore the market withstand that?
S, I have been reading some of the same dire economic impact figures of the alternative health care bills and certainly that has my attention too! If one believes polling on the topic and if law makers pay attention to that there is very low interest in the proposed plans. Hopefully the Republican defections will continue and they can just sit down and work to improve the current law.
Premium Members,
This week’s Weekly Stock Screen And Watch List has been uploaded to The Blue Collar Investor Premium Member site and is available for download in the “Reports” section. Look for the report dated 06/30/17.
Also, be sure to check out the latest BCI Training Videos and “Ask Alan” segments. You can view them at The Blue Collar YouTube Channel. For your convenience, the link to the BCI YouTube Channel is:
http://www.youtube.com/user/BlueCollarInvestor
The report for next week (07/07/17) won’t be available until late Sunday evening. I will be running in the NJ Rugged Maniac Race on Saturday, 7/08/17 and won’t be able to begin the report per the usual schedule. In addition, the report for 07/14/17 won’t be available until sometime on Monday afternoon 07/17/17. I will be out of town working with Alan at the Washington, DC chapter of the American Association of Individual Investors seminar on 07/15/17.
Best,
Barry and The Blue Collar Investor Team
barry@thebluecollarinvestor.com
MDSO – Am I missing something here? Still offering enticing looking options at the 75 and 80 level, and behaving well technically:
Justin,
The reason that MDSO is not a “Bolded” stock is that if did not pass the MACD screen. The MACD is below the “Zero” line.
Best,
Barry
Thanks Barry – what I meant though was, since the options seem so expensive, am I missing not knowing about an upcoming FDA result or similar? And good luck being a Rugged Maniac – hopefully you won’t need to post your next report from a hospital bed 🙂
Justin
Justin,
I don’t follow MDSO so I am unaware of pending news. However, the next EA is in 2-1/2 weeks and it appears to be making its mid quarter IV expansion as it approaches the EA. If you’re not a member (free sign up), look it up at Ivolatility.com and click on the 1 year IV graph.
http://www.ivolatility.com/options.j?ticker=gold&R=1
Justin,
here again you have a nice candidate, but 3% is a red flag ROO. Especially for only18 days.
Probably it’s because the PE ratio is 132 (Yahoo), and as Jay and spindr0 posted above, the helthcare bill jitters.
Roni
Roni,
Take a close look at the MDSO chart. You will notice bearish
divergence on both the MACD and Slow Sto. If you also look at the OBV, On Balance Volume (an indicator used to track institutional participation in a stock), you’ll also notice that the institutions are beginning to exit the stock. So your thoughts on the risk might be justified.
Best,
Barry
Thanks Barry,
sorry for delay. I was busy with medical issues (my wife).
I will check the MACD and OBV as you recommend.
Normally I just trust your professional analisys blindly, so I never need to check them personally.
Besides, I am quite inept in these matters, and I become easily overwhelmed by too much info.
Roni
Roni,
I hope all is well with your wife. My prayers are with you.
Best,
Barry
Thank you Barry
Alan,
Are high beta stocks better for covered calls?
Dan
Dan,
Let me start by saying that, in my view, implied volatility is more significant than beta because IV is forward-looking and beta is historical.
That said, there is no right or wrong regarding the degree of volatility of the underlying whether it’s historical or anticipated. High beta stocks are more appropriate for those with a higher risk-tolerance and also in a bullish market environment as high-beta stocks outperform in bull markets and low-beta stocks outperform in bearish markets.
Also, note that beta stats will vary from vendor to vendor depending on the benchmark and time frame utilized.
I look for initial time value returns for 1-month near-the-money strikes of 2-4% This keeps me in the IV range that is aligned with my personal risk-tolerance which can differ from investor-to-investor.
Alan
Stocks that don’t drop in price are better for covered calls ;->)
Alan;
Would you treat a stock with an upcoming Ex-Div date in the same manner as a stock with an upcoming earnings report? For example, TOL has an Ex-Div date July 12th. Would you:
– Consider as a CC candidate as normal
– Exclude and move on to other candidates
– Wait until after Ex-Date to consider
– Buy stock now uncovered and cover after Ex-Date
Thanks;
Terry
Terry,
Ex-dates and ER dates are not treated as similar events. ER dates are always to be avoided in the BCI methodology. Ex-dates are the main reason for early exercise although not guaranteed for assignment.
Ex-dates need to be managed only if retention of the underlying security and/or capture of the dividend is a critical part of the strategy and trading style employed. This will vary from investor to investor.
For me, I regard early assignment as a plus because it means I have maximized my current month trade (premium + share appreciation for OTM strikes) and now have cash freed up to generate a 2nd income stream in the same contract month.
For management of ex-dates, see the “Portfolio Overwriting” chapters in both versions of “The Complete Encyclopedia”:
Alan
A pending dividend prior to expiration increases the return if assigned but other than being taxable if non sheltered, it has no effect on your Static Return since the loss incurred as share price is reduced on the ex-div date is recovered on the Pay Date when you receive your dividend.
Premium members: New file added to member site:
We have added a file titled “Ask Alan Video Topics” in the “resources/downloads” section of the premium site.
This file categorizes the more than 130 Ask Alan videos by the chapter titles found in both versions of “The Complete Encyclopedia for Covered Call Writing”
As new monthly AA videos are added, the file will be expanded.
Our goal is to enhance the learning process by organizing and incorporating all the BCI educational tools. For example, if you are studying exit strategies, you can reference all the videos under the heading of “exit strategies” + the Exit Strategy DVDs + Chapter 10 of both Encyclopedias + the ES book.
For new members, the full library of Ask Alan videos is located on the left side of the member page (scroll down towards bottom).
Alan and the BCI team
Alan,
If I own a stock that pays a dividend on 15th and I have written a covered call on it and it’s called away on the 14th who gets the dividend?
You are entitled to receive the dividend if you own the stock on the ex-dividend date. The Pay Date is when you receive the dividend. If the stock is assigned before the ex-div date then you will not receive it.
http://www.investopedia.com/terms/e/ex-dividend.asp
Well, one day does not make a month. My late June bargain hunting paid off today, If seasonality plays out with positive economic reports this week July should be fine despite headwinds from our crazy world and zany politics.
I have yet to read an unhedged or uncaveated bullish prediction for the rest of 2017 from folks I follow.
Everyone is in the “Yes, but…” camp. That is not when markets crash. That is when they climb “The Wall of Worry” higher. – Jay
I’m really impressed with your writing skills as well as with the layout on your weblog. Is this a paid theme or did you modify it yourself? Anyway keep up the nice quality writing, it is rare to see a nice blog like this one these days..
Ila,
I’ll pass your generous comments on to my team. They’re the ones who deserve the kudos.
Alan
Dr. Ellman,
I have a question. I don’t consider myself ‘ignorant’ to finance, but I cannot figure out why my account ‘net’ balance does not increase after selling a covered call. My ‘cash’ position increases, but not my account value. I’ve spoken to my online broker about this question, and am now more confused than ever. Is this a broker-related issue, or am a just ‘missing the big picture’? I’ve penciled-out the math, and I can’t figure it out.
I know you are a busy man, and I apologize for asking this ‘administrative’ question, but your help would be appreciated.
Pedro
Pedro,
I’m happy to clear this up as it can be a bit confusing. It is a standard broker accounting practice to post option sales as a (negative) until the position is either closed, exercised or expires worthless.
The cash generated from the option sales is credited to your account as you stated in your post.
An analogy would be your bank posting a debit to your checking account after making a deposit until the check clears.
Alan
OK, that makes sense. Thank you for clearing that up for me. Cheers!
Pedro
Hi Alan,
I have a question regarding the weekly watch list. Why does the stock list appear twice, once on page 3 and what appears to be the same list at the end of the report? Are they different?
Jay
Jay,
The content of both lists is precisely the same. The one at the end of the report is in larger print to accommodate members who are visually challenged.
Alan
Also for enabling copy & paste I read somewhere before.
A very useful feature btw that a lot of people don’t know is
to hold down the Ctrl key and turn the mouse wheel to increase/decrease text and image size on a page.
Justin, Thanks for sharing that! I’m constantly re-sizing the browser’s Zoom level since some web sites have print smaller than normal.
You’re welcome spindr0! 🙂
For those using touchpads btw, Ctrl + and Ctrl – does the same thing.
Yes, we also have the final 2 pages of the report specifically to enable copy & paste in addition to a full view of the report in a larger font.
Alan