Fundamental analysis, technical analysis and common sense principles comprise the 3-pronged approach used in the BCI methodology for screening for option-selling candidates. Technical analysis is the factor that changes most frequently and is the main reason a stock will get “bumped” from our Premium Stock Reports. In our 11/10/2017 Premium Stock Report, MKS Instruments (NASDAQ: MKSI) was removed from our “eligible” list and moved to our “Passed Previous Weeks & Failed Current Week” section. Since this equity has been on our eligible list for a good part of 2017 and generated a significant amount of income for our members (this author included), I felt it would be instructive to evaluate why the BCI team moved the stock from our highest-rated category.
Weeks 1 – 4 for the November 2017 contracts (partial image)

MKSI Gets Bumped from our Premium Stock List on 11/10/2017
The yellow fields show that MKSI was eligible in the first 3 weeks of the November contracts but not in the 4th week (red arrow).
Why was MKSI Bumped (moved from white to purple cells)? Report Explanation
 The green arrows point out the following technical concerns:
- The momentum indicators (MACD Histogram and Stochastic Oscillator) turned negative
- The price of the stock is no longer above, but rather at, the 20-day exponential moving average
It is important to recognize the fact that stock prices whipsaw and there frequently are technical improvements from week-to-week, so this is the reason we leave formerly eligible securities on our lists for 3 weeks before removing them entirely from our reports. It is not prudent to immediately sell a stock already in our portfolios if it is moved from the eligible white cells. It is, however, always critical to be alert for all exit strategy opportunities.
MKSI: Technical chart
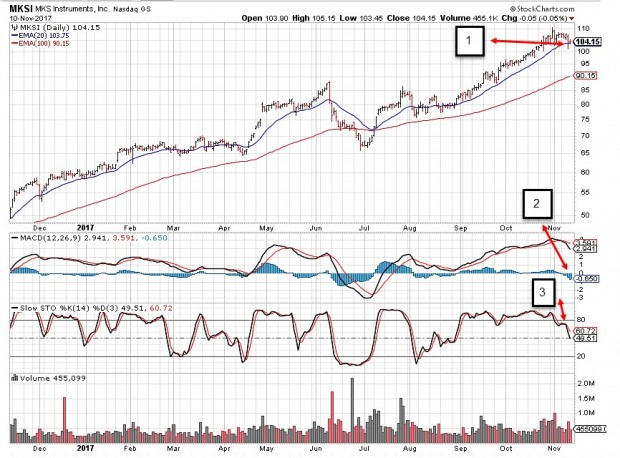
Technical Chart for MKSI on 11/10/2017
The red arrows highlight the following:
- 1: Share price moved down to the 20-day exponential moving average (previously above this line)
- 2: The MACD Histogram moved below the zero-line
- 3: The Stochastic Oscillator dipped below the 80%, a bearish signal
Discussion
Upcoming event
American Association of Individual Investors: Charlotte NC Chapter
Saturday June 9th 9 AM – 12 PM
“How to Generate Monthly Cash Flow and Buy a Stock at a Discount Using Two Low-Risk Option Strategies”
Myers Park United Methodist Church
1501 Queens Road
Charlotte, NC 28207
Market tone
This week’s economic news of importance:
- Case-Shiller home price index March 6.5% (6.5% last)
- Consumer confidence index May 128.0 (127.5 expected)
- ADP employment May 178,000 (163,000 last)
- GDP revision Q1 2.2% (2.3% expected)
- Weekly jobless claims 5/26 221,000 (225,000 expected)
- Personal income April 0.3% (0.3% expected)
- Consumer spending April 0.6% (0.4% expected)
- Pending home sales April -1.3% (0.6% last)
- Nonfarm payrolls May 223,000 (200,000 expected)
- Unemployment rate May 3.8% (3.9% expected)
- Average hourly earnings May 0.3% (0.2% expected)
- Markit manufacturing PMI May 56.4 (56.5 last)
- ISM manufacturing index May 58.7% (58.9% expected)
THE WEEK AHEAD
Mon June 4th
- Factory orders April
Tue June 5th
- ISM nonmanufacturing index May
- Job openings April
Wed June 6th
- Trade deficit April
Thu June 7th
- Weekly jobless claims through 6/2
- Quarterly services Q1
- Consumer credit April
Fri June 8th
- Wholesale inventories April
For the week, the S&P 500 moved up by o.49% for a year-to-date return of 2.28%
Summary
IBD: Confirmed uptrend
GMI: 6/6- Buy signal since market close of April 18, 2018
BCI: Favoring 3 out-of-the-money calls for every 2 in-the-money calls. Politics, as it relates to the global economy, is inhibiting a more aggressive approach to investing.
WHAT THE BROAD MARKET INDICATORS (S&P 500 AND VIX) ARE TELLING US
The 6-month charts point to a neutral to slightly bullish tone. In the past six months, the S&P 500 was up 2% while the VIX (13.46) moved up by 20% (but on a more recent downtrend).
Wishing you much success,
Alan and the BCI team
Alan,
I want to sell NAKED puts, I realize one of your rule is don’t sell NAKED.
What do you think? Where can I learn how to do NAKED put option writing?
Alp,
Most brokerages will require retail investors to place the cash into our brokerage accounts to purchase the shares of stock we are obligated to purchase when we sell a put option. For example, if we sell a $30.00 put option for $1.00, our broker will require us to place $2900.00 per contract [($30 – $1) x 100)] into our account when selling the put. Therefore, the strategy is selling “cash-secured” puts, not “naked puts”
That said, we have a book and DVD program (streaming or hard copy) that teaches the strategy:
https://www.thebluecollarinvestor.com/alan-ellmans-selling-cash-secured-puts/
https://thebluecollarinvestor.com/minimembership/selling-cash-secured-puts-more-information/
Alan
Alp,
Alan answered you clearly about brokerages requiring Cash secured puts, which is the case for non-margin accounts.
****
Tip on searching Blog postings:
You can use the Search Facility at this website to search for past blog posts to see what others may have written on your subject.
I wrote a blog post on April 28, 2018 on Trading levels which can help. To search for it, I did the following:
Search #1:
I entered the following:
“mariog Etrade fidelity levels puts calls” without the quotes
Notice the above search gives you many blog posts which use those words.
I then tried the following search to see if I could pinpoint my exact blog posting and it worked. I used the quotes tool of Google search to search for the EXACT words that I used in the article. -What words you enclose in the quotes the Search must find exactly. Powerful feature.
Search #2:
mariog “general information on trading levels”
The above search just give you my blog post for April 28, 2018.
You can gain a mountain load of information by using the search tool over the many years Alan has been here.
*****
If you read that blog post using the above information, I describe in detail the Trading Levels at Fidelity and Etrade Brokerages. After reviewing my comments, I noticed minor changes or errors in some of the description. You can check for your self by reading the Options Applications or Options Upgrade application at each company. Please note that different rules apply to Individual and Retirement accounts.
With regards to your Naked Puts question, you can this in a margin account at both Fidelity and Etrade.
*For Fidelity – Level D: Uncovered Writing of Equity options
*For Etrade – Level 3: Naked Puts ( Naked Puts are probably allowed at Level 3 instead of level 4 because they have limited risk (maximum loss stock price goes to zero)
Note: For Naked Calls, Fidelity requires Level D and Etrade requires Level 4 (unlimited risk for these options)
Mario
Premium Members,
This week’s Weekly Stock Screen And Watch List has been uploaded to The Blue Collar Investor Premium Member site and is available for download in the “Reports” section. Look for the report dated 06/01/18.
Also, be sure to check out the latest BCI Training Videos and “Ask Alan” segments. You can view them at The Blue Collar YouTube Channel. For your
convenience, the link to the BCI YouTube Channel is:
http://www.youtube.com/user/BlueCollarInvestor
Best,
Barry and The BCI Team
barry@thebluecollarinvestor.com
Alan,
About your webinar “Covered Call Writing with Buy and Hold Stocks in Bear Markets”
Thanks for that. I watched it twice.
But: While the options netted a premium ($800 or so) The stocks themselves had a drastic drop. (about $2400).
Now you mentioned this was a bear market. (judging by the stock charts you literally bought right at the top, before a decline.
I still don’t understand the lesson.
I mean, you did everything right and still lost 1.5% of the portfolio value.
I understand the mechanics of adjustment and the subtlety of “buying the intel option back to keep the stock, even tho it’s “expensive”, that money is returned…
But… at the end of the month you still have a net loss from the stock decline.
Okay. So: the lesson is:
You would have lost more if you hadn’t “adjusted” and managed. Got it.
Obviously drastic bear markets don’t happen all the time. and the opposite is true as well.
Or am I missing something?
And:
Are you ever going to explain your real estate methods to your members?
-P
Phil,
When using conservative option strategies it is equally important to master how to mitigate loses as it is to realize and enhance gains. This applies to more aggressive strategies as well.
Now, the premise of the webinar is that we are using shares in a buy-and-hold portfolio of blue chip stocks that we want to retain for the long run. If our next door neighbor held the same shares and did not write and manage calls as I did in the webinar (and real-life account), that person would have lost significantly more money.
The market, in the short term, moves up and down. In the long run, it moves up. If we held 20 positions in a month during normal market conditions (the webinar trades took place in a bear market environment), and 12 were winning trades, 4 break-evens and 4 losing trades and we implemented our position management skills, we had a heck of a month!
The lesson: Covered call writing lowers our cost basis and therefore increases our opportunities to generate higher portfolio returns.
Sharing my real estate methodology: The extensive growth of BCI has been a pleasant surprise to me and my team. It requires us to dedicate 100% of our non-family time to option education. Besides, despite my financial real-estate successes, I never considered myself a true expert in that arena. I have sold a majority of my real-estate portfolio and spend my time writing books, articles, producing videos, traveling the country presenting seminars and responding to questions like this one. I consider myself extremely fortunate to have this opportunity and thank the entire BCI community for putting BCI on the financial map.
***The webinar Phil is alluding to is the Blue Hour webinar #9, available to premium members in the member area (left side).
Alan
Alan,
How many ETF’s do you normally trade each month on average (I know that the minimum is 3 for $10K account)?
What is capital requirement for that?
Thanks,
Duminda
Duminda,
I trade individual stocks in my option-selling accounts. I do trade ETFs in my mother’s, more conservative and much smaller, account.
Generally, we like to see 3 ETFs which will require a minimum cash availability of $10k – $15K.
Alan
Alan,
Thank you for your answer to my question about ETF’s.
I have noticed that ETF’s pose more problems than stocks when it comes to covered call writing in spite of their attractiveness in terms of low risk.
For example, I bought 100 shares of XLU for $51.62 per share and sold 1 option contract at the beginning of the April 18 contract cycle. The option expired worthless and I wanted to write another covered call at the beginning of the current May contract cycle. However, I could not find a suitable strike price that would meet our profit objective of 1-2% per month.
XLU is currently trading at $49.88. It has been two weeks now and I am still unable to find a suitable strike price. What do I do in this situation? Sell the ETF at a loss or hold on to it to see if the price starts to rally? As things stand now, I cannot sell another option to reduce the cost basis. How long should I wait? What if the price starts to decline further?
Please advise.
Best regards,
Duminda
Duminda,
In general, if an ETF generates a 1-2% initial time value return for near-the-money strikes at the start of one contract month, it will generate a similar return at the start of the next contract month. Adjustments will be noticed when there is a change in implied volatility or where the current market value falls between strike prices but this guideline will usually hold true.
Now, as we wait deeper into the June contracts, there will be a falloff in time value premium and it becomes more difficult to achieve the goal of 1-2%. That is now the case for XLU and most other securities. Knowledge of the logarithmic nature of Theta, guides us to the best time to sell our options:
https://www.thebluecollarinvestor.com/theta-time-decay-of-our-option-premiums/
I pulled up a chart of the $50.00 call option (June15th expiration) and it appears that this option did offer a 1-2% initial time value return at the start of the June Monthly contract.
CLICK ON IMAGE TO ENLARGE & USE THE BACK ARROW TO RETURN TO BLOG.
Alan
Trading Experiences through Monday 6/4 Week 3/4 Expiration Friday 6/15:
Jay and Roni,
Thanks for you feedback and updates here. Great to hear how others are dealing with their trading experience. So many ways to go here.
I am 93% invested now with 9 stock symbols in my 4 account portfolio and 4 stock symbols in my Joint Trust ETF account.
I have been reserving some cash to buy positions when the stock market has dipped down during this June cycle. Then waiting to add the option leg for the covered call at a higher stock price. (Friday 6/1 was a perfect day for that, when Job Numbers news came out, where I filled 11 orders on 5 symbols from 9:30am to 11:45 am, then called quits for the day.) Wrote covered call in one combination several sometimes based on the price chart and numbers.
I started using recently Fidelity Alerts on the browser to signal me when when a stock either drops below a set value or rises above a set value. Chimes a bell for me too, then send me text, email and a browser novice. Nice feature is you can add a note to the alert where I can be reminded of the action to take.
Etrade has Alerts but not as sophisticated and notifies me with text and alert on the browser (still testing).
Currently have position in my 4 account portfolio in:
*BOFI – Bank – (Roll out 32-32, 4.3%)
*KWEB – China Internet (Expired, rolled down to strike 62 5/31 on peak, but kept climbing… too bad but I am guaranteed above breakeven at 1.5%, so for this stock roll downs have helped, this stock repeatedly goes OTM near expiration, so I may not be finished with it yet)
*NSP – Bus Svcs – Staffing – (Bought positions 5/14 (86) and 5/22 (88) when it dipped low again and I had cash after Exp. Friday), sold option leg 5/29 at 92.8 strike 95 Gain 7.9% / 10.2% if exercised. I waited to option price to be at least 1.0% otherwise not worth it and just as well stay long.
*VNOM – Energy – This stock dropped today because an analyst announced a Buy to Hold change… I was able to Buy-To-Close on 2 position at 10% Rule (0.15) just before closing bell. Had beautiful rising chart. Two position down 4%, 2 positions down 9%.
* CVX – Oil stock – Still holding long. Down 3%
* ZBRA – Electronics – ID and data capture – Strike 155, Gain 2.2% if exercised, now at 153.3, still above breakeven 151.25
* AXP – Finance – Strike 100 Purchased 5/29, added option leg 6/1, Gain if exercised, 3.5%
* SPLK- Software – IT support – Bought CC ITM, Strike 111, Gain at 111, 2.6%
* RHT – Software – Servers, OS Software – I held position in this stock last cycle and unwound it at 165.9 at just breakeven. It’s Bullish at 8.9. On 5/31/18, it dropped to 162.8 and bought it long. The next day it was at 164.7 with a 1.6% CC gain. Bought one contract CC OTM Strike 165 Gain 3% if exercised. Price today is 169.45.
Hope the above is helpful to someone. Lets hope the market stays graceful till Expiration Friday 6/15.
Mario
Hey Mario,
Great update as always, thanks! Hope all your selections work this expiry!
You are using what I call “selective diversification” – which is likely an oxymoron :). You have 9+ positions concentrated into what I would group as 3 sectors: Financial, Tech and Energy. I think it is smart to weight sectors by current trend. Otherwise just use SPY and “fawgedaboud it” :)!
And with big daily swings depending on what Trump Tweets or who farts in Europe this seems a great market to buy/wait even if the trend is up.
I can also relate with what Duminda and Alan discussed above: the “Premium Blues” when IV and VIX are this low – particularly on ETF’s. My answer is let my ETFs run because to sell calls on them to get 1% I would have to sit on top of them and snuff out upside. Stock premiums are, of course, better.
As food for thought since several friends have asked about buying options I switch to that side of the trade often in low VIX environments. I use debit spreads and encourage anyone interested to read up on them at OIC or other reputable source.
In my opinion debit and credit spreads are a logical next addition to anyone’s options toolbox once comfortable with CC’s and CSP’s. I use debit spreads when premium is low and credit spreads when higher. VIX 15 a general swing point. Spreads are low capital managed risk trades more for the hobby trader than the investor looking to enhance yield through over writing or buy at a discount through CSP’s.
For whatever seasonality is worth June is the historically 4th worst month of the year. But anyone who “Sold in May and went away” would be regretting that about now. So I am always dubious of seasonality in any given year, however interesting I may find it :). A great week to all. – Jay
Hi Alan,
I’m haveing trouble obtaining a quote from Yahoo on the Option screen. Please attatched. Both items that are circled in red are greyed have the out but I can load a number in that field and submit it to the site but as soon as I press Enter, the numbers in the greyed field.. just disappear. The attached differs your a yahoo screen print that appeared in one of your books..Any suggestions?
Also once I did get a quotation, that will be my selling price (what I should receive in cash in my brokerage account. (Right).
I’m learning – albeit slowly.
Thanks for your help.
Jim
Jim,
The option quotes are located below the area you have circled. When we sell an option, we look in the “bid” column (arrow at top).
For example, the $70.00 strike generates a bid price of $1.50 (2 lower arrows). Check my books/DVDs to see how to negotiate a better price using the “Show or Fill Rule”
You’re approaching this in an intelligent way by taking your time
and educating yourself before risking even one penny of your hard-earned money.
CLICK ON IMAGE TO ENLARGE & USE THE BACK ARROW TO RETURN TO BLOG.
Alan
Jim – and anyone else interested!
I called Fidelity and you can actually create an account with a username and password and use their research, and stock and option quotes with no obligation to fund an account. It a very powerful web site. There is no time limit. I use the Chrome browser with no problems.
They run 24 / 7 so you can also call and get answers for any questions you have.
What you can also do is install the Fidelity mobile app in your phone and then actually log in also to your account for another type of experience.
Another piece of user information is I also use the the Watch Lists at Fidelity in many useful ways. The watch lists in most brokerages and web sites only allow Stock symbols to be entered (I also have Etrade brokerage accounts and they only allow symbols).
The watch lists at Fidelity function as complete portfolios in addition to being simple symbol watch lists. By complete portfolios I mean you can do the following: Enter symbols, Purchase Price, Quantity, Option Symbols (They do work – at Yahoo they never worked for me). You can drag columns easily. Many other functions. There is a limit of 50 lines per watch list, but that poses no problem for me.
I use the watch list to combine 4 accounts (2 Etrade, 2 Fidelity) into one list so I can see the total account value for all the accounts and price movements during the day. I use a Money Market account (FDLXX, FDRXX, etc) to simulate my cash account. Of course, I edit the portfolio as I make trades.
What I actually do mostly is also is run the Fidelity’s Active Trader Pro (ATP) platform on my PC for trading. It can open up the same watch lists you created on the Browser. With ATP, in the watch lists, you can also add Intrinsic Value and Time Value columns so they are calculated for you all the time. On the Browser, the watch lists does not support the two columns and you have to calculate manually from the premium, underlying price, and Intrinsic value, the time value of an option.
To use ATP, Fidelity requires you have 36 rolling trades in a 12 month period. But you can get a free 30 day trial any time by talking to a customer rep and simply asking for it.
With ATP, the only only minor issue I have had is in getting my Cash Available to Withdraw data Screen updated instantly after I make a trade in several accounts. I quickly go to a Chrome browser window and check my Cash status there. It is always accurate almost instantly after a trade is made.
Hope this helps someone. Nobody has ever mentioned to me here they use Active Trader Pro, but I imagine there are out there!
Good luck with your future trading. I studied for 4 months and read many books (including Alan’s Classic Complete Encyclopedia) before making my nervous first trade 25 months ago. And it was the worst time for it. It was an Earnings cycle where there fewer stocks in the run list for that month.
Mario
MarioG,
I might have misunderstood and if so, I apologize in advance.
I also have accounts at at Etrade. I am able to put options on watch lists.
Go to Watch Lists under Accounts. There you can customize view and create most any kind of info you wish to see. Any 16 of 99 items.
Over to the right you can enter a stock symbol and Get Option Chain, choose expiration date and click on either Bid or Ask for strike price on either Calls or Puts, depending on which you want and Add.
Again if I misunderstood what you were saying, I apologize
Hoyt
Hoyt,
I don’t recall a conversation with you on Portfolios. Searched for a blog post but no luck. I did find your blog post on a broker that has a NO EXERCISE online option for Calls in the money. Did you have any luck.
Thanks for the information. I am playing with the Watch Lists at Etrade and making a Custom View. I was able to modify the columns and a FDLXX $1 NAV line to simulate the cash balance. The total value was withing $18 of the Etrade Account Value in Complete View. Will comment more some time later after I work with it more.
I use the Optionhouse Platform you can launch from the Browser on the right side in Complete View. The Watch Lists there are simple one. I never have tried the Etrade Watch Lists with the Browser until now..
Have you ever used Etrade Pro program you can download and install on a PC?
Just trade SMH Vaneck Semiconductor in my Joint Trust ETF Account. Had 14K free that I was waiting for an opportunity. It was 1.4% down this morning. Found it with my FinViz-com watch list of weekly ETF reports stock symbols. I just keep adding new symbols if BCI releases it as part of the weekly report. I tag the current best choices from the weekly report with a quantity of 16.
Will keep SMH long till it returns to near resistance or trend line then maybe write the Option leg. Added an Alert in Fidelity to notify me with a comment note on what I plan to do.
Mario
Mario,
I was referring to your post just above my post about Etrade only accepting stock symbols.
No luck on finding an online “No Exercise” feature.
I have used Etrade Pro, but very little. I used TC 2000 and it predecessors from Worden Bros. for years and have never found anything close. I am trying to learn OptionsHouse now that Etrade has bought it. Not as comfortable with it’s charting as I was with TC 2000.
From what I hear at Etrade they will probably let all platforms except OptionsHouse, die.
I traded stocks for 30+ years, options for 5 years, covered calls for 6 months and now beginning to trade options on futures.
OptionsHouse is supposed to be the platform for all of this.
I trade mostly options, Leaps, weeklies, monthlies and sometimes various 2,3,4,5 and 6 monthly expirations.
How I pick these is like the TD Ameritrade ad where the guy says, “It’s complicated”. It is but it has worked for me so far.
I have found that the BCI Run List is not only great for covered calls but good for buying options if you screen for trend, momentum, beta, ranking and number of weeks on the list. Sometimes one on the list for the first time may be at a sweet spot on it’s chart and is an excellent candidate.
There are many ways to “skin a cat” and no one way is for everyone.
The BCI formula is the best for a conservative, low risk tolerance and minimum time expended approach.
Take care,
Hoyt
Why do companies change exchanges sometimes? I purchased IART a few weeks ago, and in the last few days it was announced that it would be moving out of it’s current exchange into the midcap400, which I think is a bigger exchange. I don’t know what to make of this, but the price per share has moved slightly south. Any insights?
Thank you Joanna
Joanna,
There is a difference between an index and an exchange. The former is a benchmark of stocks that meet certain criteria like market capitalization (total value) while the latter is a venue where shares can be bought and sold.
A formal definition for the S&P MidCap 400 Index, more commonly known as the S&P 400, is a stock market index from S&P Dow Jones Indices. The index serves as a barometer for the U.S. mid-cap stock sector and is the most widely followed mid-cap index.
Here is a link to an article explaining the placement of IART in this index which generally is a positive for a stock:
https://finance.yahoo.com/news/evergy-set-join-p-500-220600661.html
Alan
Premium members:
This week’s 8-page report of top-performing ETFs and analysis of ALL Select Sector Components has been uploaded to your premium site. The report also lists Top-performing ETFs with Weekly options as well as the implied volatility of all eligible candidates.
New members check out the video user guide located above the recent reports.
For your convenience, here is the link to login to the premium site:
https://www.thebluecollarinvestor.com/member/login.php
NOT A PREMIUM MEMBER? Check out this link:
https://www.thebluecollarinvestor.com/membership.shtml
Alan and the BCI team