PLEASE SEE A REVISION TO THIS ARTICLE AT THE END OF THE POST. I MADE AN ERROR AND REVERSED THE NUMERATOR AND DENOMINATOR IN ONE OF MY CALCULATIONS. THE CONCEPTS ARE ACCURATE BUT THE MATH NEEDED TO BE TWEAKED.
I have written several articles on the use of VOLQ (Nasdaq-100 Volatility Index) to establish a trading range for Invesco QQQ Trust (Nasdaq: QQQ) when writing our option contracts. Many members of our BCI community have inquired about a more universal application using implied volatility (IV) stats to accomplish similar results for all stocks and ETFs. The answer is yes, and this article will use a real-life example with Copart, Inc. (Nasdaq: CPRT).
Initial stats and strategy procedure
- 7/19/2021: CPRT trading at $140.15
- Use standard IV stats to determine an annualized projected price movement based on market option pricing
- Convert that annualized IV stat into one specific for the current option timeframe (days to expiration or DTE): 32 DTE
- Calculate the projected price range based on the IV specific stat
- Check the option-chain to see if we can generate a premium that will bring the breakeven down to the low end of the range while still generating enough time-value premium to meet our goals
Implied volatility of CPRT on 7/19/2021: 20.23 (www.ivolatility.com)

CPRT: IV on 7-19-2021
Converting the annualized IV stat to a 32-day IV where the August 2021 contracts expire on 8/20/2021
- The formula we use is: Annualized IV/ (Square root of 365/DTE) = 32-day IV for CPRT
- 20.23/Square root of 365/32) = 20.23%/3.38% = $4.74 higher and lower than current market value
- The projected range during the August 2021 contracts is $135.41 – 144.89
- Next, we view an option-chain to see if we can generate a minimum premium of $4.74 which will both bring us down to the low end of the range ($135.41) and also have a time-value component that will meet our strategy goals (10% – 15% annualized, as an example)
Option-chain for CPRT on 7/19/2021

CPRT: Option-Chain Data on 7-19-2021
Our objective is to generate at least $4.74. The $140.00 strike falls short ($3.50), and the $135.00 strike is more than we require but will more than suffice if the time-value requirement meets our goals. Let’s calculate using the BCI Elite Covered Call Writing Calculator/ multiple tab.
Our best calculator for both calls and puts
CPRT: 1-month calculations for the August 2021 contracts

CPRT Calculations Using the BCI Elite Covered Call Calculator
The calculator shows a 1-month initial time-value return of 1.1%, 32-day return, 12.5% annualized which does meet our goal range of between 10% and 15%.
Discussion
A reliable projected trading range can be calculated using implied volatility stats and a conversion formula. When we have a low-end of the price range breakeven met by selling call option premium while still having a time-value component that meets our goals, we will have created a low-risk/high reward approach to option-selling.
Math Revision
The formula for the expected trading range using IV is shown in the screenshot below. In the case of CPRT, the 32-day IV is [(20.23) x (sq.root of 32/365) = 5.99%.
5.99% of 140.15 = an expected price movement of $8.39 in both directions as shown in our BCI Expected Price Movement Calculator:
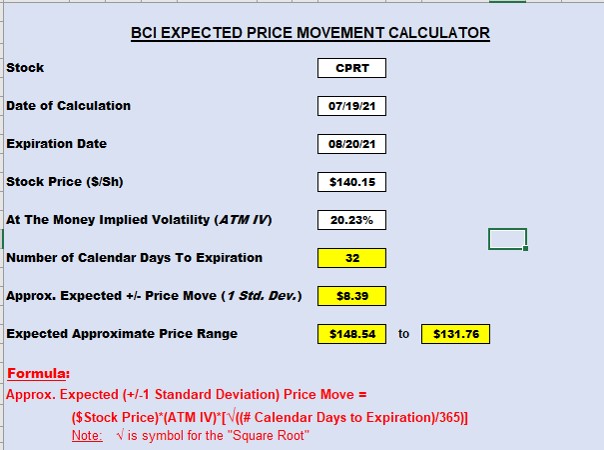
CPRT: Expected 32-Day Trading Range
Your generous testimonials
Over the years, the BCI community has been incredibly gracious by sending our BCI team email testimonials sharing stories as to what our educational content has meant to their families. Moving forward, we have decided to share some of these testimonials in our blog articles. We will never use a last name unless given permission:
Hello Alan,
I highly appreciate your free content already for years. It’s great. It has just been lately that I got to access the US options market and still struggling to get profitable. So, I guess I’ll take a deep dive into some of your books :). Please keep it up. I’ll stay a fan.
All the best,
Uwe
Upcoming events
1.BCI-only free webinar: February 17, 2022, at 8 PM ET
Introducing a New Exit Strategy and Exit Strategy Term
The platform allows 500 attendees so click on this registration link a few minutes before 8 PM ET.
Click here for a preview video (make sure you’re on our mailing list to get the link … sign up on the right side of our blog page…scroll down to “Free Newsletter”).
Exit strategy implementation is a critical aspect of successful covered call writing and put-selling strategies. Over the past 15 years, the BCI team has been creating rules and guidelines regarding our trade entries and adjustments while always seeking to enhance the opportunities to elevate our returns to the highest possible levels.
This webinar will introduce a new exit strategy and exit strategy term that can be applied to both covered call writing and selling cash-secured puts. We have also integrated this new exit strategy into our upcoming BCI Trade Management System which includes our new Trade Management Calculator. This new tool is the first of its kind anywhere and will be available to our BCI community during the 1st quarter, 2022. You have been asking for a trading log that allows us to both enter, adjust and calculate final returns and now you will have it.
This presentation will include scenarios when the exit strategy can be applied, how to apply it and show calculation results using both stocks and ETFs for both calls and puts.
Let’s learn from each other and use this information to become the best and most elite of all option traders.
2.Long Island Stock Investors Meetup Group
Stock Options: How to Use Implied Volatility to Determine Strike Selection
Creating 84% probability successful trades for covered call writing and selling cash-secured puts
Wednesday April 13, 2022
7:30 PM ET – 9:30 PM ET
3. LIVE at The Money Show Las Vegas
May 9th – 11th
Details and registration link to follow.
2 presentations:
Portfolio Overwriting (free)
Increasing Profits in Our Buy-And-Hold Portfolios Using Covered Call Writing
A Comprehensive Analysis of Covered Call Writing: 2-hour Master’s Class (paid event to The Money Show)
How to master all aspects of this low-risk option-selling strategy

***********************************************************************************************************************
Market tone data is now located on page 1 of our premium member stock reports and page 1 of our mid-week ETF reports.
****************************************************************************************************************
Dear Alan. Thanks for your incredible articles. I am currently practicing the ultra low risk IV strategy with covered calls and Cash Secured Puts in my paper account.
Covered Calls. Do the 20/10% guidelines should remain the same with IV strategy? Or we need to modify the % since the premiums are lower.
CSP. Does the 3% guideline should also be applicable? Or do we need to lower this %.
Thanks so much for your support as always.
Alex,
Yes, the 20%/10% guidelines apply to ultra-low-risk approaches to option-selling. They are particularly useful when we can’t monitor our trades several times a day.
The 3% guideline is based on a monthly initial target initial time-value return goal range of 2% – 4%. With our ultra-low-risk strategies, our target returns are much lower. As a guideline, consider closing the put trade once the share price declines below the strike price which was once deep out-of-the-money but now in-the-money.
Alan
Thanks Alan
Hi BCI Community,
You can also get specific strike price IV (Implied Volatility) metrics from your brokerage platform. The trading platforms from all of the major brokerage houses have the capability to provide IV data in their option chains. You can call your broker’s tech support line to get instructions for your specific platform.
Best,
Barry
Hi BCI Community,
Staying with the “Expected Range” theme, you can save some time by using your brokerage platform. Many brokers have “Standard Deviation” data available. You can use this data to get a very close approximation to the calculated expected price range. As you can see below, Schwab’s StreetSmart Edge platform provides standard deviation data for every strike price. The 1 standard deviation metric can be used in place of the calculator to save a bit of time. However, if your platform does not have that data, the “BCI Expected Price Movement Calculator” will get the job done for you.
Click on the image to enlarge. Then click on the back arrow to return to the blog.
Best,
Barry
Premium Members,
This week’s Weekly Stock Screen And Watch List has been uploaded to The Blue Collar Investor Premium Member site and is available for download in the “Reports” section. Look for the report dated 02/04/22.
Also, be sure to check out the latest BCI Training Videos and “Ask Alan” segments. You can view them on The Blue Collar YouTube Channel. For your convenience, the link to the BCI YouTube Channel is:
http://www.youtube.com/user/BlueCollarInvestor
On the front page of the Weekly Stock Report, we now display the Top Performing ETFs, the Top SPDR Sector Funds, and the 4 single Inverse Index Funds. They are sorted using the 1-month performances from the Wednesday night ETF report and the prices from the weekend close.
Best,
Barry and The Blue Collar Investor Team
barry@thebluecollarinvestor.com
Alan,
I’ve been using your portfolio overwriting approach for my long term holdings, targeting an annual return of 6% (page 341 of Encyclopedia 2). It seems to me that we can also use IV to get a high range and use that as our strike price. Am I correct?
Thanks,
Randy
Randy,
Yes, excellent observation. We can establish a high probability upper range in cases where we want to avoid exercise.
Alan
The Expected Move Calculator (below) uses a different formula which multiplies by the stock price and the sqrt (instead of dividing by it).
Tom,
Good catch. See the revision I made to the article at the end of the post.
Alan
Alan, math isn’t my long suit, but my calculator’s better at it. When I divide 20.23 by 3.38 I keep getting 5.985. How do you make the jump from there to $4.74?
Bill
Bill,
Another good catch.
Check out the post revision. 5.985% of $140.15 computes to $8.39, not $4.94.
Alan
Alan,
When you are doing portfolio overwriting, what is a reasonable expectation for premium return on an annual basis?
Thank you.
Marty
Marty,
The lower our annual time-value return goal range is, the less chance of the need for exit strategy intervention to avoid exercise.
As a guideline, I would target 4% – 8%, with 6% being a reasonable average portfolio overwriting annual goal.
Alan
Alan,
Which do you think is better and why: Using premium money to buy more shares of the core holding dividend paying stocks in my portfolio (ones that I categorically do not writing covered calls on) OR using the premium money to buy shares of the QQQ?
I’m fifty years old and, to date, have been reinvesting all dividend and premiums into JEPI, an income generating ETF, given the low interest rates banks offer. I thought this was a good idea in that I could simply use JEPI as if it were a savings account of sorts (it pays about a 7% yield). Thing is, I’m not sure if this is the right thing to do with the passive income I get from my stocks.
Your insight would be most welcomed….
Thanks,
Marcus
Marcus,
Both of your dollar-cost-averaging ideas are quite reasonable approaches to re-investing option premium profits.
Investing in QQQ (large cap tech companies) is a bit more aggressive and, therefore, risky, but with a much higher ceiling.
Investing in high-quality dividend-bearing securities will offer is a safer, more conservative approach. By the way, QQQ does offer a small dividend.
A 3rd approach would be to do both and split option premium profit by dollar-cost-averaging into both.
Keep up the good work.
Alan
Dear Alan;
On December 21, 2021 the QQQ was trading at 388.76
and I sold the 400 call strike expiry January 21,2022 for $4.37 . The QQQ closed on January 21, 2022 at 350.11 and the option expired worthless.
I want to retain and continue trading the QQQ hoping to turn this loss into an eventual profit. Which BCI strategy works best – the portfolio overwrite using OTM strikes with Deltas of <16 or the strategy in the BLUE HOUR WEBINAR #15 that turns a loss eventually into a profit?
Thank you,
Donna
Donna,
If we own shares that we want to retain for the long haul due to the confidence we have in the security, we treat our approach as we would for portfolio overwriting.
As such, I would favor the ultra-low-risk IV or Delta approach to establish the high mark for the trading range and sell calls at or above that strike as long as our returns meet our stated goals.
By the way, your question motivated me to review Blue Hour webinar #15 which I hadn’t seen in a while. Brought back some fond trading memories. Thanks for bringing it up.
Alan
I’m having trouble with the above calculation. I don’t get the $4.74 from the formula — I calculate 5.985.
Can you help, please?
Thanks,
Ron Miller
Ron,
Your math is accurate. See the last paragraph of the article that begins with:
Math Revision
The formula for the expected trading range using IV is shown in the screenshot below. In the case of CPRT, the 32-day IV is [(20.23) x (sq.root of 32/365) = 5.99%.
5.99% of 140.15 = an expected price movement of $8.39 in both directions as shown in our BCI Expected Price Movement Calculator:
Also, see the screenshot added to the article reflecting the correct calculations.
Alan
Premium members:
This week’s 4-page report of top-performing ETFs and analysis of the top-performing Select Sector SPDRs has been uploaded to your premium site. One and three-month analysis are included in the report. Weekly performance has also been incorporated into the report although not part of the screening process. Weekly option availability and implied volatility stats are also incorporated.
The mid-week market tone is located on page 1 of the report.
New members check out our ongoing and never-ending training videos (“Ask Alan” and Blue Hour webinars). We add at least one new video each month. Only premium members have access to the entire library of these training tools.
For your convenience, here is the link to login to the premium site:
https://www.thebluecollarinvestor.com/member/login.php
NOT A PREMIUM MEMBER? Check out this link:
https://www.thebluecollarinvestor.com/membership.shtml
Alan and the BCI team