When selling covered call or put options, strike price selection is one of the three required skills. Here are the main factors we evaluate when determining which strike price to select:
- Overall market assessment
- Personal risk tolerance
- Return goals
- Technical price chart
In this article, we will focus in on the technical parameters that will guide us to the strike price that will offer the greatest chance of successful covered call trades. To highlight the relationship between price chart patterns and strike price selection, we will use real-life examples for Nvidia (NVDA) and Charles Schwab (SCHW). Charts and calculations were created the weekend prior to the start of the January 2017 monthly contracts. At the time, NVDA had a bullish technical chart pattern while SCHW had a mixed technical chart.
BCI guidelines for the relationship between chart patterns and call strike selection
We will favor out-of-the-money call strikes that meet our return goals when there is a bullish chart pattern and in-the-money call strikes that meet our goals when charts show mixed indicators. We will assume a goal for initial returns of 2% – 4% per month.
NVDA: Bullish chart pattern
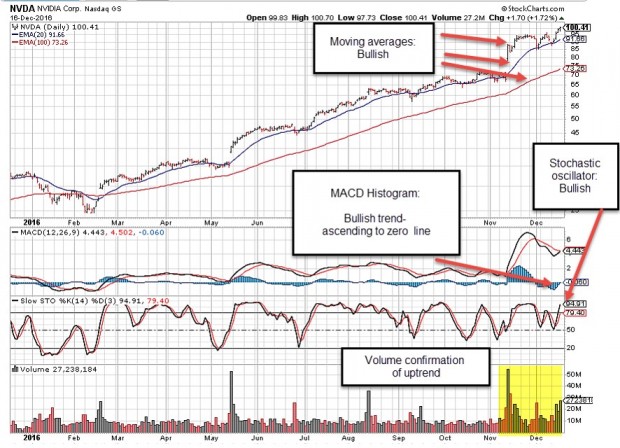
NVDA Technical Chart: 12/2016
SCHW: Mixed chart pattern
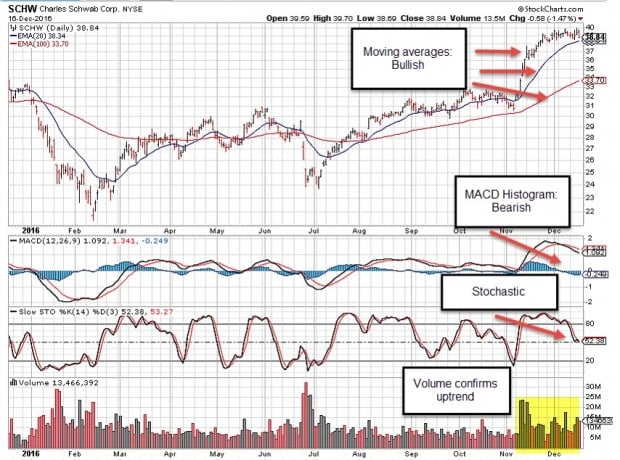
SCHW: Mixed technical Chart Pattern
Calculations based on technical analysis
The option chains for the two securities where analyzed specifically looking for out-of-the-money strikes for NVDA and in-the-money strikes for SCHW that generated an initial time value 1-month return of 2% – 4%. The information was entered into the multiple tab of the Ellman Calculator:

Calculating Initial Returns for NVDA and SCHW
Note the following:
- Yellow field: The time value return for both options did meet our goals of 2% – 4%
- Brown field: The out-of-the-money $105.00 strike for NVDA offered the opportunity of an additional 4.6%, 1-month return if share price moved up to the strike by expiration resulting in a potential 7.1%, 1-month return
- Purple field: The in-the-money $38.00 strike for SCHW offered a 2.1% downside protection of the 2.6%, initial return. I view this as an insurance policy on the initial profit paid for by the option buyer, not by us.
Discussion
There are several factors that guide us in strike price selection and technical analysis must be part of that evaluation process. Bullish chart patterns guide us to out-of-the-money call strikes while mixed chart patterns encourage in-the-money strikes.
Next live event
American Association of Individual Investors
Washington DC Chapter
Saturday July 15, 2017
9 AM – 12:00 PM
“Using Stock Options to Buy Stocks at a Discount and to Bring Portfolio Returns to Higher Levels”
Co-presenter: Dr. Eric Wish, Finance Professor, University of Maryland
Market tone
Global stocks extended gains this week mainly due to moderate global growth and subdued inflation data. All three major US indices set all-time highs. Oil continued its decline with West Texas Intermediate crude falling to $47.35 a barrel from $48.95 a week ago. Volatility, as measured by the Chicago Board Options Exchange Volatility Index (VIX), remained historically low, falling to 9.76 from 10.8 last week. This week’s reports and international news of importance:
- The May employment report was a disappointment with 138,000 new jobs were added last month, while revisions to March and April data trimmed 66,000 from pervious totals. Economists had expected a rise of 184,000 nonfarm payrolls
- Wage gains were steady at 2.5% versus a year ago
- A bright spot in the report was the continued fall in the unemployment rate, which moved down to a 16-year low of 4.3%. While weaker than expected, the data likely won’t discourage the US Federal Reserve from hiking rates later this month
- German chancellor Angela Merkel said the times when Europe could rely on others were over. She said while friendly relations with the US and UK are needed, she added that “we have to fight for our own future ourselves”. The German federal election takes place on September 24th
- European Central Bank president Mario Draghi downplayed the probability of any change in policy at next week’s rate-setting meeting. Economic growth is improving but inflation remains muted the central banker said, adding that the economy still requires substantial stimulus
- Saying he was elected to represent the voters of Pittsburgh, not Paris, US president Donald Trump this week announced that the United States would pull out of the Paris climate deal
- Optimism weakened in a few districts, the Fed reported in its Beige Book. Seven of the 12 Fed districts reported growth as “modest” since the last report on April 19th, while four reported “moderate” growth and one district — New York— was flat. Markets still expect the Fed to hike rates later this month, but with inflation pressures moderating, future rate hikes are less certain than they were earlier in the year
- While manufacturing in the US and China moderated slightly in May, Europe continues to show strength. The eurozone manufacturing purchasing managers’ index firmed to 57.0 from 56.7 in April, the highest in six years
- With 492 of the members of the S&P 500 Index reporting, earnings are expected to have increased 15.4% in the first quarter versus the same quarter a year ago
- Excluding the energy sector, earnings rose 11.1%
- Revenues are up 7.3%, and up 5.4% excluding energy
THE WEEK AHEAD
MONDAY, JUNE 5th
- Productivity (revision) Q1
- Markit services PMI (final) May
- ISM nonmanufacturing index May
- Factory orders April
TUESDAY, June 6th
- Job openings April
WEDNESDAY, June 7th
- Consumer credit April
THURSDAY, JUNE 8th
- Weekly jobless claims 5/27
FRIDAY, JUNE 9th
- Wholesale inventories April
For the week, the S&P 500 moved higher by 0.95% for a year-to-date return of 8.92%.
Summary
IBD: Market in a confirmed uptrend
GMI: 6/6- Buy signal since market close of April 21, 2017
BCI: I am fully invested in the stock portion of my portfolio currently holding an equal number of in-the-money and out-of-the-money strikes
WHAT THE BROAD MARKET INDICATORS (S&P 500 AND VIX) ARE TELLING US
The 6-month charts point to a moderately bullish outlook. In the past six months, the S&P 500 was up 12% while the VIX (9.76) moved down by 31%.
_____________________________________________________
Wishing you the best in investing,
Alan (alan@thebluecollarinvestor.com) and the BCI team


Hi Alan,
another week, another wonderful article.
You know it, but I wish to state it again :
The BCI strategy for consistent gains is perfect, and your tactics are simply great.
Roni
Roni,
Thanks for your generous post and thanks to you and all those who contribute to this blog which adds so much to the learning process for all of us.
Alan
Hey Roni,
Hope you are having a nice weekend. I am with you: my core strategy is hold investments I believe in selling options to reduce risk and increase yield. And I love these blogs every week!
But at the risk of expulsion from the Community I confess I have been working the buy side of options more than the sell side in my small trading allocation since premiums are so low.
I have been using SVXY and the FANG stocks buying calls ITM with about .8 Delta. I use a small amount of money since it it is trading/gambling. When it works it is a lot of fun and when it doesn’t it never hurts much. – Jay
Thanks Jay,
my weekend was quite busy, that’s why I saw your post only now.
Your hold strategy is probably the best there is.
When i look at all my trades of the last 2 years, it is clear that I could have made much more money if I had simply held them without selling options.
The point is the higher risk tollerance necessary, especially during significant events, and corrections.
Further, I enjoy the dayly fun of the covered calls trading.
Lastly, I feel that when I concentrate all my efforts to a single task, I can master the skills much faster.
And the “lower” premiums you mentioned, are actually huge yelds: ATM ROO @ 2% a month is 24% per year.
I believe there is no better low risk investment available for us.
Roni
Roni, our exchanges must be boring for others to read since you and I mostly just just add to each other’s points :).?
And as we both know it is tempting to look back over any period of time and say “Man, if I had only done this or that I would be better off”. That is hind sight. It is never wrong no matter what aspect of life we apply it to :)!
But that is not how we make our decisions today about a future we can’t predict.
When it comes to investing I believe if we find a strategy or two we study thoroughly – as you have done – take as much emotion as possible out of it, diversify enough to sleep at night and always keep the hunger to learn more we can’t go too far wrong! – Jay
Yes Jay, you are right,
but as you know, I have no other investing friends here in Brazil, so “talking” to you is very important to me.
Cheers – Roni
Roni, I value our “chats” also!
Speaking of Brazil I have a small position in EWZ . I have not been over writing it like I should. My other South American holding is Chile (ECH). It has been clobbering SPY this year! I consider them investments so I do not get too fussed over short term price movements. Same with INDA, EWG and EWY.
It seems EWZ and ECH correlate better with gold than with global stocks. Does that sound right to you? – Jay
Yes Jay, it sounds right.
The Brazilian economy was showing a timid recovery last month, but a new corruption scandal erupted as JBS president “volunteered” a colossal plea bargain against Brazil’s president and many other politicians, and investors are very concerned about the immediate future.
JBS is probably the largest meat company in the world. They also have many companies in the US, (pilgrim’s was the latest aquisition) all aquired with public funds supplied by Brazilian state owned banks and funds, through corruption deals with former and present presidents and high rank politicians.
I beleive Chile’s economy is doing very well, except for the copper mines which are suffering from low price of the comodity.
But living closer to Chile does not mean we know more than you do about the country.
I hope this helps.
Roni
Thanks Roni,
That is very helpful. I saw the drop in EWZ last month and figured it was something like what you described.
See you in the next blogs :)! – Jay
Premium Members:
This week’s Weekly Stock Screen and Watch List has been uploaded to The Blue Collar Investor Premium Member site and is available for download in the “Reports” section. Look for the report dated 06/02/17.
Also, be sure to check out the latest BCI Training Videos and “Ask Alan” segments. You can view them at The Blue Collar YouTube Channel. For your convenience, the link to the BCI YouTube Channel is:
http://www.youtube.com/user/BlueCollarInvestor
Best,
Barry and the BCI Team
barry@thebluecollarinvestor.com
Recently released Premium Stock Report:
Premium members will note that our just-released premium stock report has over 100 eligible candidates. Normally our stock reports contain between 30-60 candidates. This attests to the recent strength of the market, particularly in technology.
Focus in on the “Industry Segment” column to avoid duplication and maintain diversification.
Most industry rankings are “A” or “B” so this column will not eliminate candidates but stocks in “bold” are the strongest from a technical perspective and the “Risk/Reward” column can also serve as a source of selection.
The (recent) price can also dictate which securities to favor depending on our portfolio size and cash available.
Three stocks have earnings reports due out during the June contracts so keep an eye on those dates if you are considering these stocks.
Finally, you will note that 17 of the listed stocks do NOT have adequate option liquidity (open interest) as of market close on Friday. We are often asked why we include these in our lists. The reasons are twofold:
1- Liquidity can change during the contract month
2- Some members use our lists to buy and sell stocks without the option component in portfolios outside their option-selling portfolios.
All good!
Alan
Alan:
Love what you do and what and how you share advice with everyone. I was just thinking that another component of your calculator can be DELTA of the option. So if i wanted to keep my stock but wanted to keep the premium of the option i might look for a delta of 25 or maybe less. So maybe others would be ok with a 1.5% gain and lower delta strike or make other tradeoffs. Just a thought.
David,
Welcome to the group!
I find when I sell credit spreads or over write calls a good place to start is the .25 Delta. When I buy options I want to have a delta of .8 or higher since I want the option to act like the shares and buy very little time value. So Delta is a good one of “The Greeks” to understand as you point out.
On the options sell side having an initial return target will get you in the right neighborhood even if you don’t look much at Delta, in my view.. Bet if you buy for speculation or if you buy a LEAP as a stock replacement it is important to know what the Delta is so you do not mistakenly buy a low priced/low Delta option with mostly time value in it thinking you are getting a “bargain” – Jay
David,
There is a way to accomplish this without involving a Greek Calculator or turning to additional resources to research Delta stats. We can use the multiple tab of the Ellman Calculator and check the options chain for out-of-the-money strikes. We then favor the strike that best meets our time value goal for initial returns, in this case 1.5%.
Should share price rise, we can then turn to our position management skills to avoid exercise.
Alan
Alan,
Since your growing number of members (now including me) are all focusing on selling options on stocks from your Watch List, to what extent does that concentrated selling drive down options prices, making your strategy less and less able over time to generate the 2-4% ROO that it used to generate?
Thanks,
Zack
Zack,
Although the BCI community is growing and substantial (thanks to all of you for that), it is still the institutional traders that impact and move the markets. I am referencing mutual funds (leveraged), hedge funds, banks and insurance companies.
The implied volatility (keep an eye on the “VIX” for overall market volatility) will have a direct relationship to the time value returns available to us.
Currently, the VIX is historically low, but we can still access returns for initial time value between 2-4% for many securities. Even 1-3%/month is impressive.
Alan
Alan,
I’ve been a member now for a few months and have thus been trying to learn the ropes of covered-call writing. During the course of that I’ve discovered what appears to me to be conflicting motivations, and I hope you can share your perspective.
1. You emphasize that picking strong stocks and funds is important, presumably so that one doesn’t lose more money due to price declines than one makes selling the options.
2. If such a stock is in a strong uptrend, it often overtakes and passes the strike price of the call options sold against it. This limits the upside to that of the strike price unless one buys back options which are now in-the-money.
3. Buying back options in this scenario usually means spending more to buy back the options than the cash made on selling them in the first place. This works fine as long as one has the cash available to do this, and if the stock price doesn’t later fall and thus deprive one of eventually realizing the unrealized gains by selling at a high price.
In summary, if a stock is in too strong an uptrend, it would seem to be a difficult candidate for covered-call writing because of the frequent and cash-intensive “chasing” of the share price. It therefore feels like there’s a sweet spot for covered-call writing: a stock which is stable but not too strong.
What are your thoughts on the matter?
Thanks,
Scott
Scott,
Let me offer another perspective.
If this scenario comes to fruition in every covered call position in our portfolio, the returns would be incredibly high. It would mean that we have maxed every position in our portfolio in the form of time value option premium + share appreciation from current market value to the out-of-the-money call strike.
We should have 2-4% cash reserves in the event we need to buy back options but we are never under any obligation to do so. We can always opt to “allow assignment” if the calculations dictate (use the “what now” tab of the Ellman Calculator to make these decisions).
I do not see share appreciation above an out-of-the-money strikes as a problem but rather as best case scenario.
Alan
Alan,
Thank you for sharing your perspective. I believe I understand what you’re saying. Let me come at this from another angle, that of buy-and-hold vs. buying stock and then selling covered calls. Here’s a made-up set of scenarios to illustrate.
Scenario 1 — Buy and hold the stock
1. Buy a stock at $100/sh.
2. Stock rises to $104 over the course of two weeks.
3. Sell stock at $104
NET PROFIT = $4/sh.
Scenario 2a — Buy stock and sell covered calls against it, without allowing assignment
1. Buy a stock at $100/sh.
2. Sell $102 call expiring four weeks out for, say, $1/sh. of time value
3. Stock rises to $104 over the course of two weeks.
4. Buy back the option for $2 of intrinsic value and $0.50 of remaining time value.
5. Sell stock at $104.
NET PROFIT = $1 option sale – $2.50 option buyback + $4 stock sale = $2.50/sh.
Scenario 2b — Buy stock and sell covered calls against it, allowing assignment
1. Buy a stock at $100/sh.
2. Sell $102 call expiring four weeks out for, say, $1/sh. of time value
3. Stock rises to $104 over the course of two weeks.
4. Stock gets assigned for $102/sh.
NET PROFIT = $1 option sale + $2 stock sale = $3/sh.
While I realize this is a made-up scenario, I hope it communicates my concern that a stock in a strong uptrend may be a better candidate for buy-and-hold than covered-call selling. It appears that the cost of buying back into the uptrend can be greater than the profit gained from betting against the uptrend in the first place. Or is my scenario an example of poor portfolio management and I shouldn’t have allowed the stock to get to $104 before taking action? I’m eager to hear your further thoughts if you have time.
Thanks,
Scott
Scott,
My responses:
***1- Your concern can be summarized in the following fact about covered call writing that is in all my books and DVDs: The main disadvantage of covered call writing is that profit potential is limited by the strike price. You are correct about this and we are in full agreement.
2- The covered call trade in this hypothetical generates a 1%, 1-month premium return with an additional 2% upside potential (from $100 to $102). Therefore, our goal is a 3%, 1-month return. That goal is realized if share value reaches $102 up to infinity…but our goal is reached.
3- In my view, it is not relevant to react productive when our goal is reached and we can find another strategy that would have generated a higher return. We can find such scenarios with any strategy we use…all have pros and cons. As an example, if share price in this example closed under $102.99, covered call writing beats pure share ownership.
4- In scenario 2a, the position should not be closed at a time value debit of $0.50…no action needed here.
To sum up: We set our goals and, if achieved, we have a successful outcome. We are never 100% sure a stock will surpass a strike but we can always write a deeper out-of-the-money call if we are in an extremely bullish market environment.
Alan
Scott,
Thanks for taking the time to write out the scenarios. My only add to this discussion is please remember selling options is a remarkably flexible strategy.
Today, for example, I am wary of both current events and traditional calendar seasonality so I have many things covered for June. I did not feel that way earlier in the year and hardly wrote calls at all. If you like a stock consider selling a cash secured put to acquire it and once you do maybe only cover half the shares or ladder the strikes. Maybe even keep a little stable of “race horses” you never cover at all and only overwrite your “plow horses”?
My suggestion is these strategies are as flexible as you want to make them to fit your view of any market, sector or stock at any time. – Jay
Alan, I was wondering what u think of weight watchers? Really good covered call premium. As well as what your thoughts are on Twitter.
Thank you,
Mike,
You are correct in that both securities offer excellent option premiums…in the 2-4%per month range.
Both stocks fall a bit short in meeting the BCI fundamental screens. TWTR also falls a little short from a technical perspective whereas WTW has a strong technical chart. This does not mean that we cannot be successful with these underlyings but rather that we have stronger candidates on our current premium stock list.
Alan
Alan, Thanks for those replies to last weeks questions of mine.
I need to confirm some things and 3 questions to follow too:-
1. To get confirmation on this, if when using only blue-chip stocks, that I would need 5 stocks in 5 different industries just like the premium report stocks?(it’s just that the lowest priced stock is at $68 – quite high!)?
2. And confirming too that no need to research for R/R or beta
either for under 10 blue-chip stocks?
——————————————————————————–
Now for a technical situation I always find myself in and wonder if I am doing the right thIng:-
1. If a stock is in a short Down-trend but within a longer term Up-trend then is it still alright to buy this certain stock, or even roll-out the stock?
2. For the same scenario above, could I possibly roll-out if price is below the EMA’s, and both(or one) momentum indicators are negative, with the price fairly close to the longer Up-trendline?
(could this be risky at all?)
3. Again in relation to the above question, if you were to agree that I could do a roll-out, so then should the re-selling of the next months option ‘only occur’ after the price has then rebounded back above the 20d-EMA(or both EMA’s)?
I know the EMA’s especially the 20d one you have used as trading buy/sell signals so hence it is obvious why I had needed to enquire about that.
Thanks for your understanding on this.
Adrian,
1- Yes, best to be properly diversified, if possible. An alternative related strategy would be to use the Select Sector SPDRs which break up the S&P 500 into 10 categories. These are always included in our Premium Member ETF Reports.The latter will require less capital.
2- Yes, confirmed, no need. We start with the premise that we want only blue chip stocks and that overrides the more traditional screening process.
Will come back to the other 3 questions.
Alan
Adrian,
1- If a stock is trading under its 20-d EMA, I will defer to a different security. Our obligation is 1-month and the shorter-term price pattern is more relevant. If investing in a long-term buy-and-hold portfolio, I would change trend parameters and perhaps use 50-day and 200-d simple moving averages
2- Rolling decisions imply that the price is above the strike. So generally speaking, the price chart will not be bearish. If trading under the 20-d EMA and rolling is “on the table” I will usually allow assignment and move on to a different security in the following contract month.
3- If rolling is being considered, we are limited to making a decision by 4 PM ET on expiration Friday. If trading below the 20-d EMA, I will usually allow assignment. Again, finding ourselves in a “rolling position” with price trading under the 20-d EMA is unusual. This implies that the original option sold was deep, deep ITM.
Alan
Premium Members,
One of oue subscribers noticed a typo on the “Stocks Passed This Month…” page of the 06/02/17,Weekly Report. The blue header line currently reads “Month: January, 2017” should read “June, 2017”. The typo had no impact on any of the stocks in the report.
Best,
Barry
SINA price and contract adjustments:
This is an interesting situation. Glad one of our premium members brought it to my attention.
SINA is distributing shares of a company it owns (WB) to all shareholders. In other words, for every 100 shares of SINA we own, we also will own 10 shares of WB (worth about $750.00). This is partially why SINA value has declined recently because when a dividend is distributed (in the form of cash or shares), the value of the stock goes down by that amount.
Now, as for the options, generally new options will be created that will have a ticker something like SINA2 and they normally appear when the standard (original) contracts no longer trade (today). However, I see no bid-ask quotes so I called someone I know at the options exchange and was told that there are times it takes a day or two to get published quotes for these adjusted contracts. I expect we will be able to trade options on SINA by tomorrow or Wednesday.
Let’s keep an eye on this together.
Alan
I’m confused. In your COMPLETE ENCYCLOPEDIA FOR COVERED CALL WRITING (original);page 192; para 1 under FIGURE 77; second sentence; “open interest is generally a higher number than volume because it is cumulative, whereas volume is reset to zero at the beginning of each day.” I was understanding that VOLUME is generally higher. for example the chart above FIGURE 77. Help! Thnks.
Don,
Although there are exceptions, open interest will be higher than Vol (ume) because the former is cumulative and Vol is reset to zero each day as shown in the pre-market screenshot of SBUX below.
Figure 77 from the “Complete Encyclopedia…” represents a hypothetical where both start at zero and was designed to show the mathematics of how each is calculated.
CLICK ON IMAGE TO ENLARGE & USE THE BACK ARROW TO RETURN TO BLOG
Alan