When we sell out-of-the-money call options, we are initiating bullish covered call writing positions. Our goals are to generate option premium as well as share appreciation from current market value up to the call strike price. When share value moves well above the strike, leaving that strike deep in-the-money, there is no opportunity to generate any additional profit in that trade. Our mid-contract unwind exit strategy involves closing both legs of the current trade and entering a new trade, with the cash generated from the sale of the stock, using a different underlying security. It is important to know how to evaluate when it is in our best financial interest to undertake this position management maneuver. In September 2017, Andrew shared with me a trade he executed where such an exit strategy decision was being considered.
Andrew’s trade
- 9/20/2017: By Ultra Clean Holdings, Inc. (NASDAQ: UCTT) at $27.90
- 9/20/2017: Sell the $30.00 Oct. 20th call at $0.77
- 10/11/2017: UCTT trading at $31.62
- 10/11/2017: “Ask” price to buy back the $30.00 call traded at $2.50
Initial calculations with the Ellman Calculator (click for free copy)

The Ellman Calculator: UCTT Initial Returns
The initial return on the option sale (ROO) is 2.8% with the possibility of an additional upside potential of 7.5% if share price moves from current market value ($27.90) to the call strike of $30.00. There is a potential 1-month return of 10.3%
Cost-to-close mid-contract
It is critical to calculate the actual time-value cost-to-close which will be less than the “ask” price of $2.50 highlighted in Andrew’s trade. Since the sale price can be no more than $30.00 while the option obligation is in place, share value will rise to current market value of $31.62 if the option is bought back (buy-to-close). The “unwind now” tab of the Elite version of the Ellman Calculator (free to premium members and available for purchase in the Blue Collar store), will deduct the intrinsic value component of the $2.50 premium and calculate the actual time value cost-to-close as shown in the screenshot below:
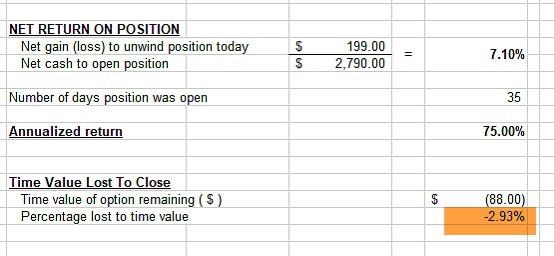
UCTT: Time Value Cost-To-Close
With 8 trading days remaining until contract expiration, our cost-to-close is 2.93%. We now ask ourselves if we can generate at least 1% more than 2.93% (3.93% or more) in the next 8 trading days?
Discussion
Generating 3.93% or more in 8 trading days is highly unlikely unless we use an extremely volatile underlying security. This makes little sense since we are employing one of the most conservative option strategies available. At this point in time, Andrew had an unrealized, 1-month profit of 10.3% with a downside protection of 5.4% (the 10.3% is guaranteed as long as hare value does not decline below $30.00). In this case, the best action is no action at all. As expiration Friday approaches, we can evaluate for the possibility of rolling the option makes financial sense.
Upcoming events
1– Long Island Stock Trader’s Investment Group
Tuesday May 8th, 2018 7 PM -9 PM
Using Stock Options to Enhance Portfolio Returns
2- Las Vegas Money Show
May 14th @ 12:30 – 1:30
Market tone
This week’s economic news of importance:
- Personal income March 0.3% (0.4% expected)
- Consumer spending March 0.4% (0.5% expected)
- Markit manufacturing April 56.5 (56.5 last)
- ISM manufacturing index April 57.3 (58.7 expected)
- Construction spending march (-)1.7% (0.5% expected)
- ADP employment April 204,000 (last 228,000)
- Weekly jobless claims 4/28 211,000 (225,000 expected)
- Trade deficit March (-) $49.0 billion (- $49.4 billion expected)
- Productivity Q1 0.7% (0.9% expected)
- Markit services April 54.6 (54.4 expected)
- ISM nonmanufacturing index 56.8% (58.0% expected)
- Nonfarm payrolls April 164,000 (184,000 expected)
- Unemployment rate April 3.9% (4.0% expected)
- Average hourly earnings April 0.1% (0.2% expected)
THE WEEK AHEAD
Mon May 7th
- Consumer credit March
Tue May 8th
- Job openings March
Wed May 9th
- Producer price index April
- Wholesale inventories March
Thu May 10th
- Weekly jobless claims through 5/5
- Consumer price index April
- Federal budget April
Fri May 11th
- Import price index
- Consumer sentiment May
For the week, the S&P 500 moved down by 0.24% for a year-to-date return of (-) 0.38%%
Summary
IBD: Uptrend under pressure
GMI: 3/6- Buy signal since market close of April 18, 2018
BCI: Selling 2 in-the-money strikes for every 1 out-of-the-money strike for all new positions. Decent jobs report confirming positive economic support.
WHAT THE BROAD MARKET INDICATORS (S&P 500 AND VIX) ARE TELLING US
The 6-month charts point to a slightly bearish sentiment. In the past six months, the S&P 500 was up 0% while the VIX (14.77) moved up by 50%. The VIX has subsided a bit more from the last week.
Wishing you much success,
Alan and the BCI team
I don’t know why I’m all of the sudden confused…probably my workplace this week has been asking me for WAY too much mentally. So I bought 100 of HQY at 66.39, then sold may 18th strike 65for a premium of $2.59. It’s now at 69.35…way way in the money. I thought that it was a good thing to buy uptrending stocks, but it now looks like I’m screwed somehow…what did I do wrong?
You know, I was thinking (which often seems to get me into trouble, but here goes…) …. wouldn’t it seem that the best stock to pick for covered call writing is a stock that’s trending sideways and not upwards? These would be the ones most likely to always expire worthless so long as strike is not below Market on expiration date right?
Thanks,
Joanna
Joanna,
Unless we are trading in non-sheltered accounts where tax issues become a major factor for long-term, low cost-basis stocks, we must be able to identify successful trades like this one.
The trade was set up to generate a time value return of 1.8% (see screenshot below- brown field) with a 2.1% downside protection of that option time value profit (yellow field). That is how the trade was established.
When share price rises, the time value return stays the same while the downside protection increases. At this point in time, there is an even greater chance for a successful outcome.
Keep up the good work.
CLICK ON IMAGE TO ENLARGE & USE THE BACK ARROW TO RETURN TO BLOG.
Alan
Hi Joanna,
An idea I will float by you – and anyone else kind enough to read my post – is you have to first know what you are trying to do with your money. I don’t say that in a flip, casual or at all disrespectful way to anyone.
Covered call writing is, in my opinion, a conservative low risk way to manage retirement money. I love it! And I owe a world of gratitude to Alan and Barry for educating me on it.
But it is not for everyone and it is not for the entirety of portfolios – even mine – because you often tie rockets to the ground :).
You make a lovely point about how the perfect covered call stock is the one that goes sideways! The essence of this is we bet we can make more money buying things and selling calls on them than we would just letting them run free. That is a bearish bet. That is why I don’t do it all the time.
It’s a great strategy to be used in concert with others. But as the old saying goes if your only tool is a hammer all your problems will look like nails :)! – Jay
Hi Joanna,
Boy, haven’t we all done that.
Only occasionally will I sell ITM calls on an uptrending stock. It is very likely to be called away and sometimes at a price where the purchasing the call back reduces your original return on the time value of the option you sold. I don’t know when you bought. It could have been one of a few days looking at the chart. So I used 04/30/18.
I went to the “Unwind Now” tab of the BCI Elite Calculator and put in your numbers using the purchase date of 4/30/18. Also the last sale price of the $65 May 18 strike was $4.57. It shows a bid/ask of $4.40-$5.40. That’s probably a wider spread than during market hours and that’s typical.
Anyway if I did it right and you bought back the call and sold the stock your return on the position would 1.50% for 6 days, realizing today is not a market open day. A yearly return of 93.0%. not bad.
If you let it be called away your position profit would be 1.80%
So you have some options here. Buy back the call and and sell another call, perhaps the $70 May 18 strike, do nothing and let it play out or buy back the call and wait to see what this weeks price action is.
As I said at the beginning I tend not to sell ITM calls on uptrending stocks unless there is a mismatch in pricing and that is very rare. A real mismatch usually means an unknown event is about to occur and someone knows about it and the it will cause the stock to go way up or way down. Something like a biotech trial is about to be stopped for either terrible news or extraordinary good news. It happens.
Having said all this, and it’s worth exactly what you paid me for it, the choice between ITM and OTH calls on an uptrending stock
has more to do with risk tolerance. Also has to do with learning.
You made a good decision. Could it have been better. Perhaps with the advantage of hindsight, yes.
My advice to not beat yourself up over money not made. Your decision was good. It yielded a profit. You gained experience and hopefully confidence.
Keep up the good work and continue to let us hear from you.
Hoyt
Joanna,
Glad you got responses from Jay and Hoyt. It all helps. I l learn from everyone’s opinion. I will present my viewpoints. I do all my calculations on paper in a standard format that agrees with Alan’s calculations. I hope some others benefit from the information, as it is not obvious what one does in this business. Takes time.
What ever way is comfortable to you is the right way. I will try to explain several ways to analyze this trade. I read your post early this morning but find time now to get on this, after doing some calculations.
First I will describe a similar trade I have with HQY, then I will analyze your trade.
*****
All prices I mention are after commission, so the percent calculations take that into account.
* 4/30/18: HQY (HealthEquity) Buy 300 @ 65.73 (Funny and hectic trade, I placed a limit at 65.60 and only sold 122 shares. Stock was climbing, waited, no change. So I replaced the limit order at 65.76 and bought 178 more. Paid extra $4.95 commission, for net average of 65.73. Sometimes I call Fidelity to try to get the second commission reversed. Since I changed to a new order, officially I should be charged. I let it go this time.
* 5/2: I added Option leg. Underlying (U) was at 66.9
STO 3cn 5/18 65 Ca @ 2.78
* Return Cost basis (RCB) Strike 65 (ITM Call)
* Breakeven (BEP) 62.95 (65.73 – 2.78)
* ROO% = 3,15% (65 – 62.95(BEP))/65 Net Gain $204.75 (0.0315 * 65 * 100)
* Downside Protection (DP) = 2.84% (1-(65/66.9))
I always record the underlying when I fill an STO so I can use that as a reference later (hit the double etc.) and for calculating the current gain. I also always keep a running log of the BEP as I perform STO, BTC throughout the history of the trade. Easiest way to calculate the gain.
Notice that with this volatile market I decided to follow Jay’s strategy “Buy and Wait” the Week 1 through early Week 3 of this month and buy at low point of a stock and wait till it peak later (or looks like a peak) to buy the Option at a higher price, giving me a net lower breakeven and higher ROO%. Normally I have been trading the covered call in one combination order in the past, which also saves a 4.95+ commission and is less time consuming if you want to get fully invested sooner or have more free time for other things.
Looking at my Fidelity Active Trader Pro chart that was around 2:30pm on that day. You bought the same stock around 12 noon at 66.39 using the same assumptions that Hoyt used in his post.
*************
Joanna’s Trade:
* 4/30/18:
HQY Buy 100 @ 65.39
STO 1cn 5/18 65ca 2.59
* RCB Strike 65 (ITM Call) Intr 1.39, Time Value 1.2)
* Breakeven (BEP) 63.8 (65.39 – 2.59)
* ROO% = 1.84% (65 – 63.8 (BEP))/65) Net Gain $119.60 (0.0184 * 65 * 100)
* Downside Protection (DP) = 2.09% (1-(65/66.39))
:
Next, what happen is I unwind this position Monday 5/7. Is it a good idea? Hoyt used 4.57 as a BTC price. I would have used the midway price (play the spread) of the bid/ask 4.4-5.4 or Mark of 4.90. I think this is more realistic. I will use both numbers to show the difference.
There are 3 ways to to calculate the Net gain after an unwind: 1-MCU Tab of Ellman calculator, 2- using percent loss from close, 3 – Using entry and exit time values
Case 1:
* Underlying at 69.34 RCB Return Cost Basis= 65
* BTC 4.90 Intrinsic 4.34 TV 0.56 BTC Loss 0.86% (.56/65)
The 0.56 means you would lose $56 or 0.86% in Gain if you unwind in a combination order. So the net gain for this position after the BTC is 0.98% (1.84 – 0.86). 1.84 Annualized is 22%, New gain of 0.98% is 11.76%.
The same result you can get by just netting the time values of the entry and exit positions.
From above:
Entry Time value of STO: Underlying 66.39, Strike 65 Premium 2.59; Intrinsic 1.39, Time Value 1.2
Exit Time Value of BTC: 0.56
Net time value: 0.64 (1.2-0.56)
Net Gain: 0.98% (0.64/65) This is the same as calculated using the BTC exit loss.
Notice you lost almost 1% gain by closing now. Alan recommends to unwind unless you can guarantee a new position with 1% additional gain or 1.86, which may be difficult to do in week 3. If you get a position for 1.5% till expiration, that averages out for the month at 1.24% (0.98 + 1.5) /2) or 14% for the year. Not worth it to do the unwind in my opinion.
Additional commission effects: Assuming $5.45 entry and $5.45 exit commissions, that turn out to be another 0.16% loss (10.90/65) or a net gain of 0.82% or $53.50. This compares with 1.84% and $119.60 if you do nothing till expiration and the price stays above strike 65.
BTC Case 2:
* Underlying at 69.34 RCB=65
* BTC 4.57 Intrinsic 4.34 TV 0.23 BTC Loss 0.86% (.56/65)
* BTC 4.57 Intrinsic 4.34 TV 0.23 BTC loss of 0.35% (lose only $23)
So the net gain for this position after the BTC is 1.49% (1.84 – 0.35). 1.49% Annualized is 17.88% . This agrees with Hoyt’s results. To include commissions deduct 0.2%.
.*******************
Joanna – My choice would be to do nothing. You might be surprised and find HQY just above strike 65 on 5/18. That has happened many time this year for me so ITM is a safe bet and it not being greedy.
At expiration you if the stock is still rising or consolidating at a higher point, you can roll up to an ITM strike. Earnings reports date is 6/18 so you have another cycle. The BTC and STO for the rollout probably be a net debit but you will just have an unrealized profit with the stock.
If the stock really gaps up what I do (others might disagree or unwind earlier) for an MCU (mid contract) unwind is to monitor the Time Value up to Week 3 of 4 cycle or a 0.1% or 0.2% loss, then do an unwind. 0.1% is a time value of 0.065 (0.001 * 65) or a $6.50 loss per 100 shares. This will free up some cash for only $6.50 loss.
To guarantee the $6.50 in a BTC debit limit order you use a limit of Strike – Time Value or 64.935 (market will only let you use 64.90 slightly higher Time value). This debit limit is the same as the Stock Price – Premium, which I have discussed on this blog some time ago. Important: This equation ONLY works for ITM calls not OTM.
Good luck in your trading.
Mario
Premium Members,
This week’s Weekly Stock Screen And Watch List has been uploaded to The Blue Collar Investor Premium Member site and is available for download in the “Reports” section. Look for the report dated 05/04/18.
Also, be sure to check out the latest BCI Training Videos and “Ask Alan” segments. You can view them at The Blue Collar YouTube Channel. For your convenience, the link to the BCI YouTube Channel is:
http://www.youtube.com/user/BlueCollarInvestor
Since we are in Earnings Season, be sure to read Alan’s article,”Constructing Your Covered Call Portfolio During Earnings Season”. You can access it at:
https://www.thebluecollarinvestor.com/constructing-your-covered-call-portfolio-during-earnings-season/
Best,
Barry and The BCI Team
barry@thebluecollarinvestor.com
Joanna,
Alan is right, you actually entered a perfect trade.
If it expires in the money, you will make 1.8% in aprox. 15 days. Wow ! Fantastic.
When annualized it is 43%. you should be cheering., and smiling. 🙂
Forget the money left on the table. We are not gamblers.
Roni
Roni,
You are exactly right.
Hindsight is 20/20 vision, or should be.
We humans are a strange breed. We pick a situation going in with an assumed outcome that is ok with us. Then if there is money left on the table we feel bad. Note, the machines do not operate that way.
I once had a sign in my office that read, “Losing money in the stock market feels a hell of a lot worse than making money ever felt good”
We all do a better job of making money if we can suppress our emotions.
That’s the beauty of the BCI system. Alan, Barry and crew do our stock screening for us(we still choose), supply us with the knowledge and tools to pick the strikes, provide us with position management techniques(awesome spreadsheets) and provide us with this forum. All for around a buck and a half a day
Joanna made an excellent conservative trade. Alan’s notes say that he is making 2/3 of his trades ITM at this time.
Hoyt
Thanks for all this great information.
Do most people buy-write covered calls, or does anyone first own shares for a while until they have built up enough profit that getting assigned is both welcome and returns higher profits due to being able to sell calls that are way in the money?
Joanna,
One of the most important advantages of covered call writing is that the strategy can be crafted to the specific goals and risk-tolerance of each investor. Many (like yours truly) use ccw in its traditional sense where a stock is purchased specifically for the purpose of writing a call option to generate cash flow. Some (over) write calls on shares already owned and perhaps appreciated significantly. There is also an approach that uses ccw to add cash to a sell order. There is no right or wrong here. The most appropriate approach is based on trading style, return goals and risk tolerance.
Alan
Joanna,
personally I do “buy/write” most of the time. (because I’m chicken).
Our good friend Jay, prefers “buy/wait”, and is very successful, because when the market is volatile, he buys the stock on a down day, and sells the CC a few days later when the market is up.
(He has more guts, and makes more doe).
It boils down to risk/reward.
Good luck – Roni
Hey Roni, I mis-posted my reply to you and Joanna at the bottom of today’s thread….OOPS!
That’s ok Jay,
I will read it further down.
Roni
Do you offer a recommended list of covered call options…that meet your rigorous criteria?
Thank you.
Patrick
Patrick,
Our premium reports offer lists of stocks and exchange-traded funds (ETFs) that are eligible for option-selling. They are elite performers from fundamental, technical and common sense perspectives. The specific stocks and options selected for our own portfolios will vary from investor to investor based on cash available, personal risk tolerance and return goals. All this is explained and detailed in our educational products.
Alan
Hoyt,
perfect, thank you.
Roni
Alan:
Firstly, although I am new to option trading, I do believe the monthly cost to be a premium member with the Blue Collar Investor is a great value considering all the pre-screened information provided…thank you.
As stated above I am new to option trading and am really wanting to increase my understanding of the risk for a Covered Call.
In the last 30 years I have had a company provided investment program through an account at Fidelity…
Over this time I have made something like “on average” 4 to 6% on these investments of mutual and bond funds…In the last 5 to 8 years I did find ETFs and have purchased some of this type of fund…still with that type of payback.
I was never happy with this small amount of return and now that I am retired, and need something to do….this is the main reason I have got interested in trading options.
To me when I activate a covered call, the risk is small…with the largest risk being that the Stock Price goes above the strike price chosen to where the call seller cannot enjoy the extra “profit” of the amount above the strike price…however can receive the difference of the stock price at time of purchase and the strike price, if the option is exercised. This amount would be in addition to the premium received at the beginning of the trade
When the stock price goes below the original price, when the underlying was purchased,there is no risk of losing the underlying due to the call not being exercised, however the call seller does have the option of “rolling ” the option and if necessary choose a different strike price….if the call seller believes the underlying will be trading at a lower price…
Am I on the right track with regard to understanding the risk of a covered call…or am I missing something?
Thanks for all your help….I really find all your information has great value…
Regards:
Mike
Welcome, Mike to the BCI community.
I am in a similar situation as you and retired 5 years ago, but only started trading with Alan’s methodology 24 months ago after spending over 4 months reading his Classic Encyclopedia, online videos, books from the Library to try to get an understanding of options and general investment information. The Classic Encyclopedia also covers a lot of myriad information needed about the market. Later I also purchased his Cash Secured Puts book.
I am also a Fidelity and Etrade customer. Fidelity managed some of our accounts for part of the time and I had a similar experience to you. But while you are working that is your main interest to keep earning that regular income, as I had no time myself as well and when I did invest on something, the results not worth noting.
I use Active Trader Pro with Fidelity. Great program. You can call the company 24 hours and get help for almost all type of questions. Be glad to give my hints on improving your efficiency in using the tools they have. It takes time to pick up that up as well. I am always learning and currently I am spending time to learn more about their News and Research Tab which already has been rewarding.
One significant thing I do is to set up my portfolio of stocks and options in one watchlist including the cash available to trade (use a dummy Mutual fund account value $1.00) so I end up with the account value, time value and intrinsic value columns and your positions all in one window. The nice thing you can set the watchlists in your browser and when you open ATP, you can open up the same watchlist, and it reads the same account value as well (they fixed that problem). You can make changes either place but if you have ATP open, only make changes on ATP so as not to confuse the program in synchronizing changes.
The watchlist include time value and Intrinsic value columns so you can check the 20/10% rules and other exit situations easily in one screen.
The same watchlists work on the Mobile platform.
I actually use one watchlist to cover 4 accounts (2 in Fidelity, and 2 in Etrade) so I use 4 Money Market funds to simulate the different cash positions. The 50 line limit still works well with the composite list . Another watchlist is for a fifth account, which is a is Joint Trust account I have for ETF trading only as an alternative to the low CD rates we were getting.
You are able to get trading permission to trade covered calls (Level A) and Cash Secured Puts with Fidelity’s Level B, which requires you have a Most Aggressive Investment objective, otherwise it is rejected.
I also took advantage of the 2 year free trade program ($50,000 new money, you get 300). Cool, and I found out you can split the the free trades among 3 accounts I have. Another useful tip is you can only do that once a year and you repeat the process then. You actually can check your trade counts and free trades available online.
I will try another time on your questions in a new post. Until then, I did post earlier on this blog an analysis of an ITM position with my manual calculation results, which agree with Alan’s methodology when you use the tools he provides.
Be glad to exchange comments with you. You can pick up a lot of information by using the SEARCH tool in BCI to find out what Alan and members have exchanged over many years. Take advantage of it.
Mario
Mike,
I’ll add this to the great information Mario shared:
There are 2 main risks or disadvantages to covered call writing:
1. We are “capping” the upside when we sell our options. If share price moves above the strike, we will not enjoy any share appreciation above that strike. The reason so many investors are willing to do this, is that by selling options, we are lowering our cost basis and therefore increasing our chances for successful investments.
2. If share price moves below the breakeven (share price minus option premium), we start to lose money. Note, however, that this would be less of a loss had we not sold the option.
Regarding your concern for losing the stock if the strike expires in-the-money, we can always buy back the option prior to 4 PM ET on expiration Friday to avoid this. Keep in mind, however, that “allowing assignment” may be in our best interests.
Alan
Alan,
Each week on the Weekly Report you state the BCI position on the % of ITM to OTM strikes on new positions based on your interpretation of market posture. This has always confused me. I certainly understand the concept of utilizing ITM strikes vs OTM strikes but not why the ratio. I always understood this to mean you are picking a stock that might have mixed technical or even bullish technical and selling ITM options. It didn’t make sense that you would specifically want to enter positions on equities with bullish technical but only want to sell ITM options.
I couldn’t find any references to this in your videos so I went back to “the bible” (Complete Encyclopedia for Covered Call Writing) to find a reference and explanation for why you do this as a ratio. I believe you are referring to laddering of strikes on the same underlying equity. Is that correct? Your position from the latest report is you’re selling 2 ITM strikes to every 1 OTM strike on the same equity? I’m assuming that the laddering provides at least a 2% ROO and no more that say 6% ROO. Laddering of Strikes was only discussed in a single paragraph whereas the use of different strikes is discussed extensively with very clear examples.
Regards,
Michael
Hi Michael;
I will take a swing at this. The % of ITM to OTM strikes is based upon your overall market outlook. If you are completely bullish on the market you would place all OTM strikes on new positions. As you become more bearish, you add more ITM stikes to your new positions.
Best;
Terry
Michael,
Terry is spot on. In strong bull markets, we benefit from out-of-the-money strikes to secure 2 income streams in the same month with the same cash and stock (1 from option premium and the other from share appreciation up to the strike price).
In bear markets, we benefit by using in-the-money strikes which lower our cost-basis more than out-of-the-money strikes and therefore offer greater downside protection when we need it the most.
Frequently, however, market assessment isn’t well-defined and we have a bias one way or another where we don’t want to dedicate 100% of our option-selling portfolio to either ITM or OTM.
Currently, I am taking a cautious approach to my strike selection with twice as many ITM as OTM. This can be accomplished by laddering strikes (if selling 3 contracts on one stock, sell 2 ITM and 1 OTM) or by selling OTM for those with positive chart technical and ITM for those with mixed chart technical…or any combination of the above to achieve the desired ratio.
Another way to view this approach to strike selection is to say that if we had a $60k portfolio, $40k is dedicated to ITM strikes and $20k to OTM strikes, reflecting a slightly bearish or cautious approach to option-selling.
Alan
Hi Joanna, great follow up question about the various styles of call writing and Alan’s reply was perfect..
I appreciate Roni’s add but, as always, he is being too kind as he is with everyone here!
It’s been a while since I bought a stock for the primary purpose of selling a covered call or two on it before next earnings report. Yet that is a core part of the BCI method many follow with great success month in and month out! Alan and Barry also discuss CSP’s and portfoiio over writing which is more what I do.
I doubt I invented the term “buy/wait” Roni may give me credit for but I certainly have discussed it in this forum :). I prefer to build a position and let it get some run time and a little separation from purchase price before I start a call writing campaign on it. In fact, if something has high enough options liquidity I rarely buy it out right anyway. I start with selling OTM CSP’s on down days when put values rise for as many cycles as it takes to acquire it unless the fundamental story changes. Then I let it try to get some footing before I over write it. But that is only my preference because my time frrame is not expiry to expiry. Other approaches work as well or better!
So thanks for the great discussion you initiated Joanna! And thanks for your always kind words Roni.
This thread got me thinking how we all use the same strategy: incorporate options selling in our trading and investing to out perform the market.
Yet isn’t it fun to think about how many ways there are to do that in practice :)? – Jay
I am not in the habit of replying to my own posts :)! This was obviously intended for string #3 above…. – Jay
test reply… please ignore
Jay,
My Buy Wait (4/30 to 5/2) for HQY worked well and I compared Joanna’s CC Buy Write in my response to her blog post.
I went over your strategy to sell CSPUTS on down days OTM so the stock will most likely rise from there, the position ends worthless. The next cycle you also will wait for a down day and write another CSPut, Only when the stock price drops below your strike will you purchase the stock at a discount. Then you proceed to play the overwrite strategy where, at at an up day you add the option leg for a covered call position. Meanwhile you enjoy the credited income
Yes there are many ways to this business. Surprises are random. There is no sure thing but the info we have helps to make the outlook better.
Each of us has a pattern we currently like.
Mario
Mario
Hi Mario,
There are definitely no sure things! But remember with CSP’s you can buy back early, hit doubles, roll, etc;, within a period to improve results also. In a market this jumpy if something pops the CSP becomes cheap to buy back and do it again pretty quickly! – Jay
Jay,
we are in sync.
Despite my confident posts, I do not yet feel totally at ease with my trades, and I am trying to learn more each day by focusing on the CC side of the strategy before I acan tackle CSPs.
Also, I am not having enough time lately, to perfection my skills.
But as always, it is fun.
Roni
Roni,
CsPuts (Cash Secured Puts):
Alan’s Cash Secured Puts book really helps. Beats the videos, at least for me, since you can read up on the subject at your own pace and wherever you are. Covers exit strategies in detail and other relevant information. Members get a discount as well.
Comparing Out of Money (OTM) CsPuts with Covered Calls (CC):
With CSPuts you write an OTM Put. You receive the Premium as income. Cash is reserved in your cash account (Strike Price x Contract Shares) to cover the purchase of the Stock if it is assigned (Entry price drops below strike). Big difference with CsPuts versus CC is that with CsPuts you do not have the opportunity to take advantage of share appreciation if the stock price rises to an OTM CC Strike. With CsPuts you do not own the underlying stock.
Jay’s strategy adds a variation of a better opportune time to trade a CsPut. Why not wait to write the CSPut when the the stock has declined on a down day for some non-fundamental or economic issue of the stock. At this point, if you then write or sell an OTM CsPut, the stock is most likely to rise than drop further and hopefully stay above the strike by Expiration day. In the event the price of the stock does fall further below the strike, you will assigned and you will buy the strike at a lower discount price (Strike – Premium) than if you just any random day buy the CsPut, which could be a high point in price chart.
Not having share appreciation is one of the main reason I do trade CsPuts normally. However, using the buy at a low point approach seems a good reason to consider CsPuts if you really want to trade where you do not have to buy the stock initially and only do so when price drops further.
Mario
Mario,
thanks for the very comprehensive explanation.
I do have Alan’s books, and will read the CsPuts chapter again before I start to trade them seriously.
Also, I must become more confident and use Jay’s buy low and wait approach in order to generate the additional returns.
As for now, I trade mostly ATM or NTM CCs, and my ROO limits are 2% and 3%.
The reasoning is:
If the market maker is willing to pay more than 3%, he must have a good reason to do so.
On the other hand, I am not willing to risk my money for less than 2% monthly ROO.
As we all know, there are always several trades that will go against us, so if we can get 1% or 1.5% in avarage monthly gain, we will be very successful.
Roni
Hey Mario and Roni,
I appreciate you guys mentioning kindly one of my approaches to options selling: “buy/wait”.
An important caveat I must mention is I am not trying to maximize each monthly expiry. I keep score YTD against SPY. I am ahead in that horse race at the moment :).
If I were racing the Theta clock I would buy/write on post expiration Monday or Tuesday every month.
I presume the market will trend up over time and I have plenty of that :). But the market is not a linear beast. I can therefore wait for weakness before I buy things or sell CSP’s and wait for strength before I sell covered calls.
It is just one person’s point of view…..- Jay
Last 3 market days 5/4-5/8, completed my rolldowns for this cycle, added overwrites to 1 position, added 2 new CC positions to be fully invested.
AMAT – Earnings 5/17, 1 day before Expiration on 5/18. Used Weekly 5/11 for income. Rolled down to strike 53 OTM for 1.1% reduction of loss. Net loss on position 3.4% if exercised. Time to say bye. If not ITM on 5/11, will hold till 5/17 for a better outcome.
FIVE – Expired worthless last cycle, exhausting its steady rise prior to that. Recovered price so wrote option Strike 70 to cover. Gain 1.7% if ITM. Earnings 6/7 so will make sure I unwind if not assigned.
KWEB ETF – Rolldown to Strike 61 OTM for 1.3% reduction in loss. If exercised, net loss 1.6%. If not exercised will hold for next cycle since this is an ETF.
OIH – ETF – Rolldown to strike 27.5 OTM for 1.4% reduction in loss. If exercised net loss is 1.5%. If not, will overwrite next cycle.
BOFI – Add new CC BOFI ITM ROO% 1.5% At the money for maximium ROO, no downside. . Has been consolidating since 4/30 and BEP give a good margin.
GOOS – Added new CC strike 37, Gain 2.4% Found this after checking performance in a Finviz portfolio of the BCI weekly run list.
I am hoping some of these rolldowns go in my favor and are Out of the money on Expiration Friday for further recovery of any loss. Otherwise will use the money elsewhere.
4 Account portfolio, 2 Iras, 2 individual:
Portfolio is now 1.9% down from my January 1 balance. Lowest performance value was 7.23% on 2/9/18. The income tax payment I took out was 2% of the portfolio so essentially I am even for the year after 4 complete months. The RMDs taken out of my IRAs occurred Dec. 15 so it does not affect the above results.
Joint Trust Portfolio (ETF only position):
Looking better this cycle. But overall down 4.4% from January 1 account balance. This cycle up 1.7% so far. ETFs have been disappointing this year. This compares with my performance of 16% in 2016 and 24% in 2017.
Mario