When we select stocks for covered call writing or selling cash-secured puts we factor in fundamental, technical and common-sense screens (like minimum trading volume). This screening process is the foundation of our Premium Stock Reports. Frequently we will notice stocks removed from these lists only to return shortly thereafter. The reason for these whipsaws are usually related to the technical analysis component of the BCI screening process. Fundamentals generally will change only after quarterly earnings reports and common sense screens will change infrequently although we check them weekly for our members. Stocks “bumped” from our eligible watch list are given 3 weeks to recover before being removed completely from these reports. In the interim, they will remain in the shaded areas of our reports as shown below:

Premium Report Showing Eligible and Recently “Bumped” Stocks
Why stocks get bumped and quickly return to our Premium Watch List: A real-life example with UCTT
Ultra Clean Holdings (NASDAQ: UCTT) earned its way onto our premium watch list in July and August 2017 and was then bumped from the “eligible” section in early August only to return shortly thereafter. Let’s have a look at the technical chart of UCTT highlighting the whipsaws of the technical parameters inherent in the BCI methodology.
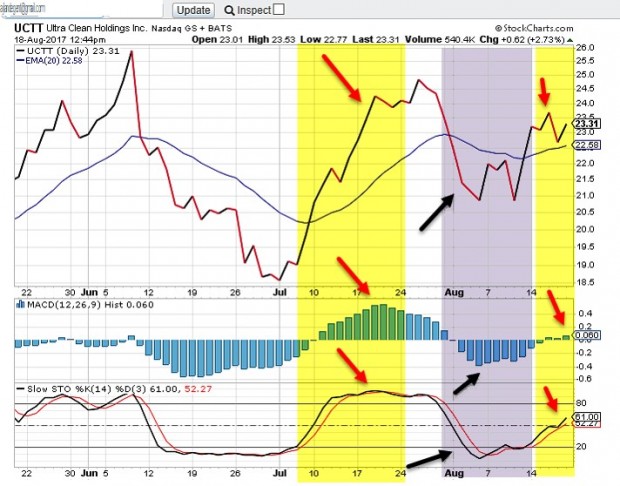
UCTT Technical Chart Showing Bullish and Bearish Signals
- The yellow field in the center of the chart shows bullish signals (red arrows). The price remains above the 20-day exponential moving average, the MACD Histogram is above the zero line and the stochastic oscillator is first ascending and then consolidating.
- In the purple field all the signals turned bearish (black arrows) with the price line moving below the 20-day exponential moving average, the MACD Histogram dropping below the zero line and the stochastic oscillator dipping below the 80% to the 20%.
- The yellow field to the far right shows an initial technical recovery with the bearish signals now turning bullish once again (red arrows on right)
Why these whipsaws are so important
The volatility of our underlying securities is what gives value to our options. This is also why it is so critical to have a system in place to select stocks and options based on currently available information. It also highlights why the skill of position management is essential to successful option-selling.
Should we automatically sell a stock if it is bumped from our watch list?
No, our positions are managed as described in my books and DVD programs once our trades are entered. However, if we sell a stock because of compromised technicals and need a replacement stock, that security should be selected from the most current list of eligible securities.
Should we roll an option on a stock recently bumped from our list?
Possibly. Rolling an option implies that it is in-the-money at expiration and the near-month trade has been maximized. However, if I did roll an option on a stock just removed from the eligible list but still within the 3-week window, I would roll out and not out-and-up. Rolling out, by definition, means rolling to an in-the-money strike which will give us both time value profit plus additional downside protection in the form of intrinsic value.
Discussion
Stock price will whipsaw up and down. This volatility is what gives value to our options. The up and down price movement will also cause some stocks to enter, get bumped and then re-enter our Premium Watch Lists. Understanding technical charts will enhance our stock, option and position management trade executions.
Upcoming events
Portfolio Overwriting webinar for The Options Industry Council (OIC)
March 23 @ 10:30 am – 11:30 am
College and graduate school finance majors only
Quinnipiac G.A.M.E. VIII Forum
New York City
Friday March 23, 2018
“The 3-day forum, held annually in the spring, gathers some of the most successful people in finance together to share their knowledge, expertise and outlook for the future with graduate and undergraduate students”.
Market tone
This week’s economic news of importance:
- New home sales 593,000 (below expectations)
- Durable goods orders -3.7% (below expectations)
- Case-Shiller home price Dec 6.3%
- GDP 2.5% (as expected)
- Weekly jobless claims for week ending 2/24 210,000 (below expectations)
- Personal income Jan 0.4% (below expectations)
- Markit manufacturing PMI 55.3 (expansion)
- Consumer sentiment Feb 99.7
For the week, the S&P 500 declined by 2.04% for a year-to-date return of 0.60%%%
Summary
IBD: Uptrend under pressure
GMI: 2/6- Buy signal since market close of February 20, 2018
BCI: I hold an equal number of in-the-money and out-of-the-money strikes and remain fully invested.
WHAT THE BROAD MARKET INDICATORS (S&P 500 AND VIX) ARE TELLING US
The 6-month charts point to a neutral to bearish outlook. In the past six months, the S&P 500 was up 10% while the VIX (19.59) moved up by 60%.
Wishing you much success,
Alan and the BCI team
Premium Members,
This week’s Weekly Stock Screen And Watch List has been uploaded to The Blue Collar Investor premium member site and is available for download in the “Reports” section. Look for the report dated 03/02/18.
Also, be sure to check out the latest BCI Training Videos and “Ask Alan” segments. You can view them at The Blue Collar YouTube Channel. For your convenience, the link to the BCI YouTube Channel is:
http://www.youtube.com/user/BlueCollarInvestor
Best,
Barry and The Blue Collar Investor Team
barry@thebluecollarinvestor.com
Weekend in Phoenix
It was particularly special for me to see so many BCI members at my seminar presentations this weekend in Phoenix.
CLICK ON IMAGE TO ENLARGE & USE THE BACK ARROW TO RETURN TO BLOG
Alan
What ever happened to the week ahead events that used to be with the weekly article? Noticed it’s been missing past couple of weeks. Thought it was a nice concise view of the week ahead.
KP,
Thanks for the feedback. As the information in our newsletters and blog articles has expanded, we have to make decisions regarding how best to use the available “real-estate” and not have these publications too lengthy. This is a fluid situation so if we learn that members want this information re-instated, we may re-consider.
Alan
Hi Alan,
I with KP. I realized it was gone only when I looked for it Saturday wanting to know what other potential news making events were on the horizon for the week both domestic and international other than the NFP here on Friday.I like the part about what SPY and VIX are telling us and how you are splitting your call writes.
It is great that blog “real estate” is at a premium :). My feedback is recaps are interesting but if space is limited info about coming events is more helpful. – Jay
Thanks Jay…member feedback is important to us.
Alan,
It looks to me like the biggest issue I have had on stocks that I want to retain is the following:
I already have the stock, sell OTM option, stock appreciates quickly past strike price, buy back options, sell next roll out and up option, stock decreases in price and a considerable amount of the “buy up” in price is “lost”. This is especially difficult if the next option you sell may lead into the same pattern as above. One might actually be loosing money if the above keeps happening.
In these situations, it looks like selling options that are substantially out of the money is the only way to help prevent the above from happening, but even then I have had difficulties with fast stock price increase and then decreases.
An example of a stock that I have had this problem with is Target (TGT) and Cardinal Health (CAH).
Do you have any advice on this type of situation?
Carl
Carl,
This great question is definitely going to be a future blog article or “Ask Alan” video, maybe both.
When we roll-out-and-up, we are bullish on the overall market and underlying stock. Otherwise, we would simply roll-out or not use the underlying and “allow” exercise of the current month option.
When we roll-out-and-up, it is the exact same trade as if we purchased the security at that point in time and sold the corresponding (ITM, ATM or OTM) option with a very small time value cost-to-close component that slightly raises our cost basis. Let’s put some numbers to this concept:
1/22: Buy XYX at $48
1/22: Sell Feb $50 call at $1.50
2/16: XYX trading at $54
2/16: BTC the Feb $50 call at $4.10 ($0.10 time value + $4 intrinsic value)
2/16: STO March $55 call at $2
3/5 (today): XYZ trading at $48
We are we now? (from 1/22 through 3/5):
The stock price hasn’t changed. We generated $3.60 in option premium and spent $4.10 to close for a net debit of $50/contract + small trading commissions. This does not include exit strategy opportunities like rolling down which would help mitigate the unrealized loss.
Let’s say we didn’t hold this stock the previous month but decided to enter a covered call trade for the March contracts. We would buy at $54 and sell the $55 call for $2.10. The only difference between this trade and the rolling scenario is the $0.10 per contract cost-to-close the previous option raising our cost basis from $54 per-share to $54.10 per-share.
Bottom line: Rolling out-and-up is similar to entering a trade at the start of the new contract month with a small cost-to-close option debit. As long as we have our position management arsenal ready to go, we should have many more successful outcomes than break-evens or losers.
Alan
Do you ever speak in Monterey-San Jose area?
Charles,
I did speak in Cupertino not that long ago but have no events scheduled in your area for this year. My appearances are based on invitations so if you are a member of a large investment group, have the program chairman contact me to discuss.
You can access my schedule at the event link on our blog page:
https://www.thebluecollarinvestor.com/events/
I am currently fully booked for 2018.
Thanks for your interest.
Alan
Alan,
The ETF report only provides the Implied Volatility of a handful of ETS’s on the last two pages. What is the reason for that? Wouldn’t it be better to look at the IV of each ETF before you buy them i.e. shouldn’t that be a factor in our buying decision?
Thanks,
Duminda
Duminda,
The ETF Report shows the implied volatility of all eligible ETFs listed in the report. You are 100% correct that the IV should factor into our investments decisions.
Alan
Another question:
About the timing of cash received from selling covered calls. I use Interactive Brokers and receipts from selling covered calls are shown as an unrealized gain/loss on my account until the contact expires. I thought that the funds were credited to our account straightway (i.e. a realised gain to our account). I asked them the reason for that. They said I needed to “buy-to-close” that option. Can you please explain this?
Duminda,
The cash is in our accounts and available for use. The negative annotations are accounting procedures used by all brokers indicating an open short position. There are 3 possibilities regarding our short calls:
BTC as IA mentioned
Expires worthless if strike is OTM at expiration
Option is exercised and our shares are sold
We control which outcome is realized 99% of the time.
Alan
I noted that your list contains a lot of growth stocks. Can the BCI method be applied successfully to value stocks? I tend to be more of a value investor.
Richard,
Absolutely. We also provide Blue Chip (Dow 30) and ETF Reports which include value stocks. Generally, these securities generate lower premium returns than growth stocks because of their lower implied volatility but still can generate significant option premium. Also, since many value stocks provide dividend to shareholders, ex-dividend dates must be factored in.
Here is a link to an article I published related to this topic:
https://www.thebluecollarinvestor.com/establishing-a-blue-chip-covered-call-portfolio/
Alan
Trading Week 3 of 4 Expiration Friday 3/16:
3/6/18 2:40pm:
Hit Double on KBE
Last Price underlying 51.04
Sell to Open Limit 0.75, net 0.75 (zero commission account)
Return cost basis 47.99, Additional ROO% 1.6% (.75 / 47.99)
New breakeven is now 47.05 so my net position ROO gain is 8.3%.
I closed the prior leg at $0.20 (20% rule) on 3/2 which is 0.4% loss so in reality I gained 1.2% by closing and waiting for a double. This first double took 3 days for KBE to return to original Sell to Open price. Maybe this will be a candidate for a 2nd double if we have a sharp volatility downturn again this week. I will set a new BTC order for $0.05 (10% rule).
My previous Sell to Open was at 1.04 on 2/21 with underlying at 51.04. Option value decayed to 0.75 today 3/6 with the last price at 51.05. IV Bid Implied Volatility was at 19.70%.
Mario
Mario,
nice, very nice!!!!!
It is not easy to hit a double.
As a matter of fact, it is quite rare, so, congrats.
Roni
3/6/18 – Hit Double Image:
Here is the price chart image of a beautiful symmetrical hit double pattern that I described in my previous post. (Fidelity Active Trader Pro platform)
Down in 3 days 5.5%, up in three days 5.5%:
** 2/27 Tuesday (High point 51.04), 2/28, 3/1….declining
** 3/2 Friday – GTC buy to close limit order of $0.20 filled – 20% Rule with KBE at 48.37 around 10:15am
** 3/5 Monday, 3/6 Tuesday Hit Double – Filled order at 2:45pm, KBE at 51.05 with sell to open GTC Limit order at 0.75. Change in last price between the buy to close and the sell to open is 5.5%.
Mario
Exit strategy from one of our coaching students:
Hi Barry,
The system works. I followed the methodology and it turned a very bad result into a much smaller loss. As you may recall, one of my holdings was DLTR and I was deciding whether to hold or sell it based on the factors that you mentioned. Anyway, I also noticed that earning reports were being released after Tuesday’s close so I sold it yesterday at 102.50. Without that rule I would still be a holder. I just saw that it is down about $12 before the open. Obviously a bad report for them. So bottom line, even though I had a large loss (I paid 115) it could have been much worse. The loss was offset somewhat in that I was able to write a call in both Jan and Feb (a total of about $450) so that at the end of the day, my net loss was smaller than if I just bought/sold the stock.
The system works! Thanks
Take care
Larry
Hi Alan,
exactly the same happened to me :
I sold my 200 shares DLTR for 102.40 yesterday afternoon, only 7% loss after subtracting premiums.
My BEP was 109.85, and I avoided much more loss by selling before ER.
Roni
Roni,
None of us like to lose money but having the skill to mitigate losses is equally as important as the ability to generate profits.
Keep up the good work.
Alan
Premium members:
This week’s 8-page report of top-performing ETFs and analysis of ALL Select Sector Components has been uploaded to your premium site. The report also lists Top-performing ETFs with Weekly options as well as the implied volatility of all eligible candidates.
This is a rare week when only 2 of the S&P sectors are out-performing the overall market.
For your convenience, here is the link to login to the premium site:
https://www.thebluecollarinvestor.com/member/login.php
NOT A PREMIUM MEMBER? Check out this link:
https://www.thebluecollarinvestor.com/membership.shtml
Alan and the BCI team
Mr Alan,
I have recently become a BCI premier member in order to learn the art of writing covered call. Since January this year, I have been studying your books and watching training videos (lessons) everyday and night to grasp the basics of this great strategy. They have really greatly motivated me to learn this strategy further and become a CEO of my own money. However, despite being a permanent resident of the USA, I spend most of the year in Nepal.
Could you please let me know if I can trade US options (Covered Call Writing) from Nepal or should I be physically present myself over there to do so.
Thank you in anticipation your prompt response.
Yours sincerely,
BHAKTA
Bhakta,
Yes, we have a significant number of international members who trade on US exchanges. The administrative process is usually managed online but check with your broker to confirm the exact process.
Alan
Alan,
I’ve read the book and will probably sign up as a member on your website.
I was curious about how many hours a week on average that you think it would take to manage a $100,000 portfolio of five stocks using the Blue Collar Investor covered call strategies, assuming that I would be using your weekly reports as a foundation.
I’m thinking about time for stock selection and order entry of course, but also the management aspect of monitoring, implementing exit strategies, etc.
Can you give me some guidance on this? I’m not looking for hard and fast numbers that I would hold you to, just a general idea. Would you consider it a full time “job,” staying online with your trading platform whenever the market is open plus some time at night? Or more like a couple hours a day?
Thanks,
Steve
Steve,
Assuming that BCI is providing the screening aspect for you, I would estimate a maximum range between 3 – 5 hours per month once you have mastered the 3 required skills.
Based on your question, I would consider starting with a smaller portfolio of $50 – $60k and 5 positions and then work your way up to a $100k portfolio with 7 – 10 underlyings.
Alan
Thanks so much, Meg!