The BCI methodology requires fundamental analysis, technical analysis and common sense screening (like minimum trading volume and avoiding earnings reports). One of the most difficult decisions retail investors face is when to sell a stock that has depreciated in value. We all deal with such decisions every contract month no matter how rigorous a screening process we have developed.
I have developed a philosophical approach to such resolutions by realizing that it is not the stock we care about but rather the cash we have invested in that security (tax issues aside). That is what our sophisticated, structured half tells us. Our weaker, emotional side tells us not to sell the stock because we haven’t as yet “realized” that loss. Which half wins out can determine the long-term success of our portfolios. This does not mean that every time there is a price decline in an underlying security we sell and replace it. In this article, we will evaluate a stock/option position shared with me by Daniel for stock Yandex N V (YNDX) in an email dated 9/23/2016.
Daniel’s trade
- 8/22/2016: Buy YNDX at $22.23
- 8/22/2016: Sell the September 16, 2016 $22.00 call for $0.95
- 9/16/2016: YNDX trading at $20.95
The unrealized share loss is $1.28 ($22.23 – $20.95). The option premium was a credit for $0.95 resulting in a unrealized loss of $33.00 per contract. There is no action needed on expiration Friday since the $22.00 call option will expire worthless and shares will be retained in Daniel’s portfolio. The question is whether to sell YNDX or retain it and write another call for the October contracts. First we check the news for this stock and make sure there was no egregious news (finviz.com is an excellent site for stock news). There was not. Let’s have a look at the technical chart as screened in the BCI methodogy for the time frame in question.
YNDX Technical Chart from August to October 2016

YNDX Technical Chart
Note the following:
- The yellow field represents the trading range for Daniel’s positions
- The orange arrow shows the price decline below the 20-day EMA but starting to move up as expiration approaches
- The red arrow highlights the MACD histogram moving slightly above the zero line as expiration approaches
- The green arrow shows a bullish stochastic oscillator signal
- Overall, we have a mixed technical picture
When do we hold rather than sell?
I would definitely sell if serious negative news came out about the corporation after entering the initial trade or if the chart technicals completely fell apart. Neither scenario exists in this case. My final decisions are based on two factors assuming all other system criteria are met (no earnings report in the next contract, for example):
- Calculations for selling next month’s options meet our goal
- The stock is not under-performing the overall market
Comparing the charts of YNDX and the S&P 500 during the trading time frame
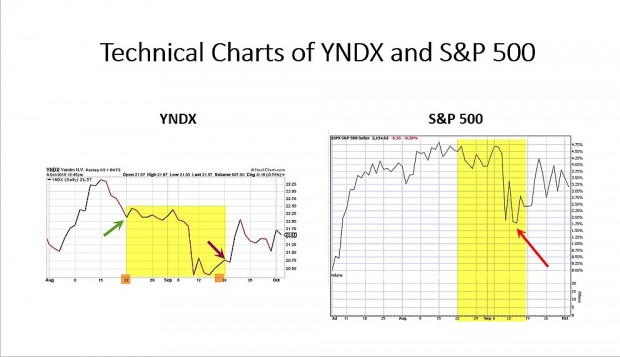
Comparing the Charts of YNDX and the S&P 500
It is clear from these charts that the overall market pulled down the price of YNDX (corresponding red arrows) and the subsequent recoveries also lined up.
Conclusion and discussion
A stock that has declined in value may still be used in the next month’s contracts if it meets the following criteria:
- No earnings report in the next contract cycle
- Chart technicals have not collapsed (mixed as opposed to completely bearish signals)
- Calculations meet our goals
- It is not under-performing the overall market
- These stocks will frequently appear in our Premium Stock Reports in the white cells but not in bold.
***Thanks to Daniel for sharing this trade with us.
Upcoming live events
1- April 6, 2017 (just added)
8:30 AM
Alan will be interviewed on Benzinga Pre-market Radio Network regarding the best strategies to use in the current market environment.
Information and link to follow
2- April 12, 2017
Income Generation Webinar for The Options Industry Council
Information and link to follow
Market tone
Global declined this week due to concerns that the Trump administration’s promised pro-growth policy agenda may be negatively impacted as GOP lawmakers failed to take a vote to repeal and replace the Affordable Care Act. West Texas Intermediate crude dropped to $47.80 from $49.25 last Friday. Volatility, as measured by the Chicago Board Options Exchange Volatility Index (VIX), rose to 12.96 from 11.2. This week’s reports and international news of importance:
- After delaying a scheduled vote on the American Health Care Act on Thursday, President Trump “pulled” a vote on the health care bill because there were not enough votes to pass the legislation. Observers grew concerned this week that if the Trump administration failed to advance one of its signature agenda items it may also struggle to pass market-friendly items like tax reform and infrastructure investment later in the Congressional session.
- British prime minister Theresa May this week set March 29th as the day that the United Kingdom will notify the European Union of its intent to leave the EU, beginning the two-year period set out in Article 50 of the Lisbon Treaty for negotiating the terms under which the UK will exit
- Eurozone banks took up more super-cheap loans than expected from the European Central Bank’s Targeted Longer-Term Refinancing Operation (TLTRO) this week
- Flash purchasing managers’ indices jumped to their highest level in nearly six years today as the eurozone composite PMI rose to a robust 56.7. Economists extrapolate from that data that gross domestic product growth is growing at a rate in excess of an annualized 2%. The euro strengthened on the data, as well as on hopes that a centrist candidate will derail populist Marine Le Pen in the upcoming French presidential elections
- Bank of Japan governor Haruhiko Kuroda said today that there is no reason to withdraw monetary stimulus now, or to raise the bank’s bond yield target, since inflation remains well below the BOJ’s 2% goal. Recent upticks in Japanese growth and inflation have raised questions as to whether the central bank could alter its super-easy monetary policy
- Exports of Brazilian meat have plummeted in the wake of a food safety scandal
- Tightening liquidity conditions in China’s banking system are raising concerns that economic growth could be negatively impacted
THE WEEK AHEAD
MONDAY, MARCH 27
None scheduled
THE WEEK AHEAD
MONDAY, MARCH 27
- None scheduled
TUESDAY, MARCH 28
- Case-Shiller home price index Jan.
- Consumer confidence index March
WEDNESDAY, MARCH 29
- Pending home sales Feb.
THURSDAY, MARCH 30
- Weekly jobless claims 3/25
- Gross domestic product Q4
FRIDAY, MARCH 31
- Consumer spending Feb.
- Core Inflation Feb.
- Chicago PMI March
- Consumer sentiment index March
For the week, the S&P 500 moved down by 1.44% for a year-to-date return of 4.70%.
Summary
IBD: Uptrend under pressure
GMI: 3/6- Buy signal since market close of November 10, 2016
BCI: I am currently fully invested and have an equal number of in-the-money and out-of-the-money strikes. Waiting to see the market reaction to Friday’s non-vote on healthcare reform.
WHAT THE BROAD MARKET INDICATORS (S&P 500 AND VIX) ARE TELLING US
The 6-month charts point to a cautiously bullish outlook. In the past six months, the S&P 500 was up 10% while the VIX (12.96) declined by 10%.
_____________________________________________________
Wishing you the best in investing,
Alan (alan@thebluecollarinvestor.com) and the BCI team


Premium Members,
This week’s Weekly Stock Screen And Watch List has been uploaded to The Blue Collar Investor Premium Member site and is available for download in the “Reports” section. Look for the report dated 03/24/17.
Also, be sure to check out the latest BCI Training Videos and “Ask Alan” segments. You can view them at The Blue Collar YouTube Channel. For your convenience, the link to the BCI YouTube Channel is:
http://www.youtube.com/user/BlueCollarInvestor
There are two additional announcements this week:
[1] The April edition of the Dow 30 Blue Chip Report has been
uploaded to the member site and can be found in the
“Resources/Downloads” section.
[2] The Weekly Report for 04/07/17 will be uploaded late in the
day on Monday, 04/10/17.
Best,
Barry and the BCI Team
Alan,
Comment on YNDX trade:
At Purchase time:
* ITM ROO% at Covered Call Purchase time = (TV TimeValue)/Strike = 0.72 / 22 = 3.27%
* BEP = S – Prm = 22.23 – .95= 21.28
* ROO Cost Basis = Strike = 22
* At Analysis point with $33 loss per contract (Stock price – BEP):
Gain = Stock price – BEP = 20.95-21.28 = $0.33
ROO% of call =Gain / (ROO Cost Basis)=(-0.33) / 22 = -1.50%
Price decline from Purchase Price = 20.95/22.23 = -5.7%
Price decline from Strike Point = 20.95 / 22 = -4.77%
Notice the loss is -1.50%, while the stock declined below the strike point by -4.77%. Most likely had it been week 2 or 3 the 20-10% rules would apply and Daniel would have Closed the option for a possible Hit a Double.
Now I would like to compare this to a OTM Cash Secured Put position and comment on why you would Unwind the position since the underlying has declined greater than 3% below the stirke.
Are the reasons the following:
* You do not have a Long Stock position with a CSPut.
* When the underlying price declines for a CSPut,it is going ITM and it is getting more expensive to close as it declines..
* A Call, on the other hand, is going OTM and is costing less to close as the underlying declines.
* Likewise, for a Call, as the price declines you have an opportunity to close the option, at an inexpensive price, keep the underlying, and then look forward to possible Hit a Double.
Mario G.
Mario,
Very well stated and analyzed. All of the reasons you included in your analysis are valid factors. The over-riding takeaway is that we must be prepared for the inevitable outcome that some of our underlyings will decline in value despite all our screening. This is usually related to overall market movement. As you mentioned, put value will rise as share value declines and the cost-to-close will become more expensive. Where and when do we take action? The BCI methodology consists of a series of guidelines to respond to these scenarios. If our goal for initial time value return is 2-4%, then closing at 3% below the strike will represent a realized loss but a manageable loss. The cash freed up from buying back the put option can now be used to secure a different put on a new underlying to mitigate these losses.
Alan
Alan,
If a stock has declined like this one and doesn’t get put on the next watch list, should we look for a different stock even if price decline was minor?
Thanks.
Henry
Henry,
Not necessarily. Our screening process is quite rigorous. If a stock like YNDX gets “bumped” it may have just missed passing all screens. If the stock in question is already in our portfolio and technicals have not broken down to a bearish picture we may choose to keep the stock if calculations meet our goals. Frequently, I will use in-the-money strikes in such situations. In a strong bull market environment, I may even use out-of-the-money strikes.
Alan
Alan;
Excellent article this week.
Let’s suppose that we have done the analysis on YNDX and have decided not to sell. We now look at the calculations for selling next month’s options to meet our goal.
My question is on selecting a strike price for selling next month’s options. Do we initially look to the same strike price that we used before; namely, the $22 call, even though it may provide lower premium? This strike would allow us to keep all our profits if and when the stock is called a way. Or do we target a lower strike price such as $21 or $20? Wouldn’t these strikes lock in a loss if and when the stock gets called away?
Thanks;
Terry
Terry,
This is an important question. The short answer is that we select a strike based on current share price where we first decide between in-the-money and out-of-the-money and then run the calculations to see which strike(s) meet our goals,
From a philosophical vantage point, we must realize that it is the cash we care about and not the specific stock. That said, where is that cash best placed? if we decide that the current equity is still a viable candidate, then we base our trade on current, not historical, data.
Let’s look at this concept using an opposite example. If we bought a stock for $50 and today it is trading at $75, we select a strike price based on today’s price, not $50.
It is critical to take emotion out of the equation and when we have a position with losing potential (not necessarily in this example with YNDX), we must still make the best decisions, the same decisions we would make had the trade been in a more bullish situation. I experienced these same concerns early on in my investment career until I realized that taking emotions out of the equation will result in much higher returns.
The takeaway from this long-winded response (sorry, my fingers kept typing!) is that we should focus on the cash, not the stock and current available, not old, data.
Alan
Alan,
Very helpful article, as always,
Roni
Paper trade experiment progressing well, showing about a 2.4% average return on expiration with the SP500 slightly down over the same period. Tried a token trade on TREX today at IB to see how it works ‘live’ and was surprised to only be charged $1 for 200 shares and 10c for the two option contracts (must have misread their fee chart!) :
Wow! Received $200 in dividends a few days ago. Did I welcome that!
Starting last month I now check the Symbols that pays dividends first in the latest Run List. Might as well take advantage of this.
I do the following with the Run List to weed them out and maximize my rewards.
List the Run list symbols in the order listed in the Premium report.
Mark with a P those with Positive Technicals,
Exclude or mark with an X those with bad number of contracts
Mark the Expiration Breakpoints time lines.
Then I mark with a D those that pay Dividends
I mark the ones I own already.
I add the Industry to each symbol.
I add the notes of those symbols which were in last weeks list (low Interest, bad spread, low OI, high volatility pattern, etc. I may still review them again in the current selection process since I am not perfect and the charts may be telling a different story.
General criteria – selection list:
* Note in the below selection order list, I check for returns in the 2-4% range, double check the OI level, and the $0.30 spread requirement initially in the selection process, I check the returns for ITM and OTM cases.
*I check both Call and Put returns and the Price chart history to check the Breakeven point with respect to any support levels that are to my advantage. Now and then you find a stock that has a good Put return / oonditions, but lousy call returns / conditions.
* I may also check Yahoo, Fidelity, Options house Quote results for news on the company, missed Earning reports in the past.
* I may double check earningwhisper.com for Earnings Report verification..
* I may double check dividend.com and dividendinvestor.com for dividend dates and yields..
* My goal is to get 90% invested in 4 brokerage accounts (Retirement and Non-Retirement at two Brokers) To do this, i do place the same trade in two or three accounts at a time in parallel. Maybe laddering ITM, OTM, if it looks favorable and trying to follow the ITM / OTM ratio Alan recommends…
To select the stocks, I then follow this order:
* I start from the bottom of the list since that will give me the best Rollout potentials before the next Earnings report.
* Select those that are Positive and have a D (Dividend)
* Select those that have Mixed Technicals with a D (Dividend)
* Select those with Positive that are left
* Select those that are mixed that are left.
* I do in addition check ETFs in the list top performing order. I checked and most ETFs pay out all dividends received.
* I also, as I have mentioned before, payout all dividends to my cash or core account since I do want small shares left over after an Unwind.
Does anyone else have a different selection process or ideas? I see from other comments that you also leg in and then later buy the option at a good market level.
Mario G.
Mario,
Thanks for the command of topic you bring to our community!
I tend to do things differently than many traditional covered call writers, As Jerry Seinfeld joked when confronted with a view other than his: “Not that there is anything wrong with that” :).
I never use same transaction buy/write tickets. I know “never” is a big word. I just don’t do it. I make the assumption every stock on Barry’s list still has some upside. So why saddle it right away? I always leg in.
If the stock goes down in the new week I would have been better off buy/writing. But It is better, in my opinion, to buy a stock, let it run a week or so, see what it does and then make your over write decision. You might lose a little time value in your call. But that’s nothing if the stock takes off. You will adjust your strike. Plus I only use stocks/ETF’s that have weeklies so I can create a “month” of my own choosing.
It used to drive me nuts seeing a stock I bought and covered on same ticket or day run away when I knew that was a distinct possibility.
Thank you, Mario, for posing an interesting question! – Jay
Jay,
Interesting strategy.
I will look at my past trades and see what trend occurred on them after buying at beginning of Week 1. I guess it is obvious using your strategy that if you see the stock is trending up that you let it be until it loses steam and then add the option for income. Interesting.
Assuming you do not use the weekly to give you a Monlh long option, I did make a quick calculation using NTES option chain (Tme value 7.0 to 6.0 change) that if you delay a CC STO to the 2nd week, the time value loses about 14%. If you have a 30000 investment, a 2.5% ROO is $750.00 gain. Losing 14% gives you 2.15% and a loss of $105. I gather if you do add back the missing week with a weekly it gets you back that 14% loss.
I gather you also have to look at the Weekly OI and Spread to determine your decision to see if it is liquid. But if you find that on many positions that your strategy pays of as share appreciation that good.
Another viewpoint from my angle is that I need to maximize my time, which I am getting better at. Initially entering into Option trades has been time consuming. I eventually want to concentrate more time on some other life events. I also want to get 90% invested to get a acceptable annualized percentage at the end of the year, including the effects of s ome bad performing trades or some negative emotional decisions.
I actually placed a CC on NVDA in later Nov. Watched it rise yo TV less that 0.2% loss, closed the option on and then realized it was rising strongly that I left as a stock and I benefited a lot. Ultimately it rose to 119 and been oscillating to 103, 110 range. Did you benefit from that rise?
NVDA has some great real time processors to handle the Auto Automation requirements, which is real time multiple input / outputs from many sensors going into a processor. Reminds me of my past work with Super minicomputers where you had to use multiple computers tied together with 50-100 foot Teflon cables to a central “shared” memory to coordinate or synchronize the actions of multiple inputs (I/O) in real time to control the complex avionics of a fighter yet or likewise for a simulator of a nuclear power plant with multiple test points / inputs (test failure conditions). Nowadays they are accomplishing in small packages what used to take lots of space in computer cabinets.
I now have a 300 sh NVDA CC at ITM strike 106 ROO% 3.2% and 300 Sh CSPut OTM strike 106, ROO% 2.7% and Purchase Discount of 4.7%. Still hangin in, Last price 107.34.
Mario G.
Mario,
The first paragraph of your reply captures my strategy perfectly.
In bullish times like these I have had better luck waiting stocks out, letting them run a bit and then selling a covered call. I might wait a month or never write at all. It’s nice to get some air between my purchase and my strike prices. Then if I want to sell an ITM call for greater income/protection it really is not “ITM” from the perspective of my purchase price.
I only use high volume stocks with weeklies. There are a lot of very interesting low volume stocks on our list well suited for speculation. I just find I do better with higher liquidity. – Jay
Hi Jay,
Agreed, the risk is in the stock.
But my reasoning is to mitigate the risk by writing a call to protect it.
My feeling is the chances are 50/50, even for the best stock, and I hate loss, more than I love gains.
To me, lost oportunity is no big deal, but lost money hurts badly.
You are right, there are many ways, and no pain, no gain, and each one of us is slightly different in this wonderful brotherhood.
Roni
Hello Mario,
Impressed with your careful analisis, and believe it must make you very successful.
I do part of your research too, but not nearly as thorough.
NVDA is probably my best choice, with consistent 2-3% income per trade, 8 times in the past 12 months.
My low risk tollerance does not allow me to embrace Jay’s leg in strategy. (many times I do regret it)
I only enter monthly, buy/write, CC trades, always in the first few days of each contract cycle, and I try to stay fully invested at all times, except before some major events.
But I am still making too many mistakes, emotional decisions, etc.
It takes a long, long time to master the BCI methodology.
Roni
Hey Roni.
Thanks for your always kind mention.
It is important to remember the risk is the stock, not the option.
That gives us endless flexibility. I like letting stocks run before I cover. Others take a different view.
There are myriad ways to skin this cat :)! – Jay
Hi Jay,
Agreed, the risk is in the stock.
But my reasoning is to mitigate the risk by writing a call to protect it.
My feeling is the chances are 50/50, even for the best stock, and I hate loss, more than I love gains.
To me, lost oportunity is no big deal, but lost money hurts badly.
You are right, there are many ways, and no pain, no gain, and each one of us is slightly different in this wonderful brotherhood.
Roni
Thanks Roni,
Happy Friday!
I have become quite risk averse myself. I read where human beings recall pain longer than they recall pleasure. That is certainly true in the market :).
I agree that covered calls are a great way to hedge against loss. I used to think of them only as a primary income generator, which they of course can be. But so many times they end up just padding one of those 50/50 stocks that do not go quite right. Thus the wisdom of selling some of our calls ITM or ATM. -Jay
Mario,
You may want to check out the Finviz website (www.finviz.com). This is a free site, although they also offer premium services. The site has:
– Excellent news section…all of the recent news articles over the past few months
– Recent analyst recommendations with price targets
– A complete overview of every important financial metric
– Recent insider trading
I check this site when:
– I am looking at stocks to select for the current month’s trades
– Everyday after I enter a trade
– Whenever I see a stock move (positive or negative) that I wasn’t expecting
This is truly a “gem” of a site.
Best,
Barry
Thank you Barry for explaining how you use Finviz.
I will follow your lead from now on.
Roni
Premium members:
This week’s 8-page report of top-performing ETFs and analysis of ALL Select Sector Components has been uploaded to your premium site. The report also lists Top-performing ETFs with Weekly options.
Next week’s ETF report will be published on Tuesday as we are moving our main office from NY to Florida next week. All articles, reports and shipments will be sent in a timely manner.
For your convenience, here is the link to login to the premium site:
https://www.thebluecollarinvestor.com/member/login.php
NOT A PREMIUM MEMBER? Check out this link:
https://www.thebluecollarinvestor.com/membership.shtml
Alan and the BCI team
I was calculating a stock in the multi tab.
stock $sh 100.09
option $sh 1.21
Strike 100.00
Expire 1/19/2019
Down side protection came out to 0.1
If down side protection is option$sh/stock$sh the answer should be 1.20 ?
Thank you
John,
The downside protection is from $100.09 down to $100.00:
0.09/100.09= 0.1% (rounded)
Alan
I’d be interested to know if anyone has found a way of automating the search for options giving greater than 2% premium (or 1% in the final two weeks)? I assume there must be some way of doing it, either by creating an AutoHotkey script, downloading a text file and creating a spreadsheet using VBA, or maybe some third-party software?