When our covered call positions end up moving deep in-the-money, we are faced with the decision to close as our maximum profit has been realized or take no action and allow assignment. In October 2017, Andrew shared with me a trade he successfully executed and was faced with such a dilemma.
Andrew’s trade with Ultra Clean Holdings, Inc. (UCTT)
- 9/20/2017: Buy UCTT at $27.90
- 9/20/2017: Sell $30.00 Oct. 20th call at $0.77
- 10/11/2017: UCTT trading at $31.62
- 10/11/2017: “Ask” price for the $30.00 call traded at $2.50
Let’s view this trade graphically:
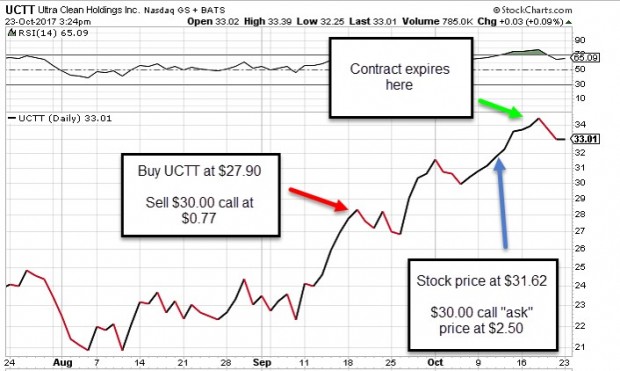
Price Chart of UCTT Trade
The question at hand is whether it is too expensive to close at $2.50…to close or not to close!
Andrew’s initial and now maximized trade

UCTT: Initial Calculations
The Ellman Calculator shows a total maximum return of 10.3% (2.8% + 7.5%). This 1-month return will be realized as long as share value remains above $30.00.
Time value cost-to-close using the Elite version of the Ellman Calculator (Unwind Now tab)
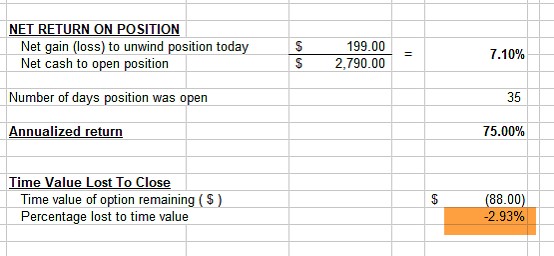
Cost-To-Close the UCTT Trade
The “Unwind Now” tab of the Elite version of the Ellman Calculator shows a time value cost-to-close of 2.93% based on current share value of $30.00. Let me break this down based on calculations after the option is bought back:
- Share appreciation: $31.62 – $27.90 = + $3.77
- Option credit: $0.77
- Option debit: (-) $2.50
- Net credit: $1.99
Percentage lost to time value:
- Cost-to-close: (-) $2.50
- Share appreciation as a result of closing short call: $31.62 – $30.00 (strike price) = + $1.62
- Net debit = (-) $0.88
- Cost basis is $30.00 (current value of UCTT due to strike in place
- Time value lost: $0.88/$30.00 = 2.93%
Analysis
Closing mid-contract
In order to justify spending 2.93% to close, we must be able to say that investing the proceeds from the sale of the stock will result in a return at least 1% higher then 2.93%. With only 8 trading days remaining until contract expiration, this is highly unlikely.
Allowing assignment
As long as share value does not decline by more than 5.4% ($1.62/$30.00) in the next 8 trading days, we will have realized our maximum 10.3%, 1-month return. Many times, the best action is no action at all. If share value continues to rise and the time value cost-to-close approaches zero, we can re-evaluate and possibly take action. As expiration Friday approaches, we can also evaluate for possibly rolling our options.
Discussion
When share price accelerates substantially and we cannot benefit any more from share appreciation positions can be closed based on the time value cost-to-close. We will spend the money if the cash generated from selling the underlying can generate a higher return than the cost-to-close by at least 1%.
For a free copy of the Basic Ellman Calculator (does not include the “unwind now” tab) , click here.
The Elite version of the Ellman Calculator is available for sale in the Blue Collar store and free to premium members in the “resources/downloads” section of the member site.
New webinar now available for Premium and Video members
Blue Hour 9: Covered Call Writing with Buy & Hold Stocks in Bear Markets
Login to your member site to view this webinar. All webinars are available and free to premium and video members only.
Upcoming events
1– Long Island Stock Trader’s Investment Group
Tuesday May 8th, 2018 7 PM -9 PM
Using Stock Options to Enhance Portfolio Returns
2- Las Vegas Money Show
May 14th @ 12:30 – 1:30
3- Just added: San Francisco Money Show
August 24th 10 AM – 1 PM
3-hour Master’s Class (details to follow)
Market tone
This week’s economic news of importance:
- Markit manufacturing PMI April 56.5 (55.6 last)
- Markit services PMI April 54.4 (54.0 last)
- Existing home sales March 5.60 million (5.52 million expected)
- Case-Shiller home prices Feb. 6.3% (6.1% last)
- Consumer confidence index April 128.7 (125.9 expected)
- New home sales March 694,000 (630,000 expected)
- Weekly jobless claims 4/21 209,000 (230,000 expected)
- Durable goods ordered March 2.6% (3.5% last)
- GDP Q1 2.3% (2.0% expected)
- Consumer sentiment index April 98.8 (98.0 expected)
THE WEEK AHEAD
Mon April 30th
- Personal income March
- Consumer spending March
Tue May 1st
- Markit manufacturing PMI April
- ISM manufacturing index April
- Construction spending March
Wed May 2nd
- ADP employment April
Thu May 3rd
- Weekly jobless claims through 4/28
- Trade deficit March
- Productivity Q1
- Markit services PMI April
- ISM nonmanufacturing index April
- Factory orders March
Fri May 4th
- Non-farm payrolls
- Unemployment rate April
For the week, the S&P 500 moved down by 0.01% for a year-to-date return of (-) 0.14%%
Summary
IBD: Uptrend under pressure
GMI: 4/6- Buy signal since market close of April 18, 2018
BCI: Selling 2 in-the-money strikes for every 1 out-of-the-money strike for all new positions. Earnings season is solid so far.
WHAT THE BROAD MARKET INDICATORS (S&P 500 AND VIX) ARE TELLING US
The 6-month charts point to a bearish sentiment. In the past six months, the S&P 500 was up 2% while the VIX (15.40) moved up by 50%. The VIX has subsided a bit more from the last week.
Wishing you much success,
Alan and the BCI team
Alan,
I am new to covered calls. I am retired and have 1800 shares of VOO -(Vanguard S & P 500 ETF). I want to do covered calls but my main concern is capital preservation and diversification. Do you recommend that I only do OTM calls or is it okay to do ITM calls with an exit strategy. I would prefer to not have my shares assigned – is that realistic?.
Please give me some guidance.
Thank you for your help! I am enjoying your videos.
Paul
Paul,
Terrific commentary from Jay.
When we sell covered calls on shares in non-sheltered accounts (my assumption here), it is best to favor OTM strikes if negative tax consequences are at issue. First, we must establish a goal, let’s say an additional 6%annualized return. Then divide by 12 if selling Monthlys. That calculates to 1/2% per month. Check the option chain for OTM strikes that return 1/2% ($1.22 for this security). That guides us to the most appropriate strike.
Other factors include avoiding earnings reports and ex-dividend dates as VOO generates quarterly dividends totaling $4.33 per year per share (1.77%).
Much more information on Portfolio Overwriting in our new (upcoming) book, “Covered Call Writing Alternative Strategies” Barry and I are reviewing the proof now.
Alan
Hi Paul,
Alan will give you better advice than I can. I am only chiming in because our situations sound similar. I too am retired and I keep a large ETF portfolio which i over write parts of for loss protection or yield depending on how the market ball bounces :).
Since you own VOO you are instantly diversified within the stock market. Bigger picture diversification includes gold, Treasuries, your home, any other property and an occasional PowerBall ticket :). Option selling will only help incrementally with capital preservation in a bear market. Your real risk is how the S&P does. I also hold and over write GLD and TLT so you may look at those also?
You are fortunate to have the flexibility of a large number of shares of VOO. So you can experiment a bit each month learning as you go. You might cover 100 shares ITM, 100 shares ATM and 100 shares OTM leaving 1500 shares alone your first month. Or do 200 shares each, whatever you are comfortable with. You will find what works for you. It is important to have a market direction view and let that guide you or follow Alan’s % laddering in this blog every week.
Again, the covered calls are a source of cash flow and loss protection. They are not a source of risk. That resides in the VOO shares.
I can’t think of a better retirement strategy than covered call portfolio over writing. I encourage you to read Alan’s material on that subject. Having shares called away is not a big deal in an IRA, replace them when they dip next. The market is not linear and it is not a tax event.
Anyway, all the best with it and nice to have you with us! – Jay
Alan,
Assume a stock with a 2.4% ITM ROO and a 4.5% ATM ROO. Assume after reading the BCI weekly stock report this is 1 of 5 stocks I want to put in my portfolio, investing $10,000 total in each. I see the market as giving off mixed signals and while it appear bullish in general I am apprehensive about a downturn. The general question I have is there any reason not to purchase both the ATM and ITM calls in the same stock if each meets my 2%-4$ goal. The specific question is I would like to buy $5,000 of ITM calls and $5,000 ATM calls in the stock rather than just $10,000 ITM calls. Aside from the obvious, giving up possible larger overall ROO, is there any downside in doing so. . It seems to me that by buying two positions the ITM calls act as insurance against the stock declining and my losing all or part of my income.
I seem to have a million questions as I am getting deeper into the BCI methodology but I am trying to limit them.
Kirt
Kirt,
2.4% ITM annualized is 28.8% per year. A great value already. So if you are apprehensive about a downturn, it is wise to give yourself downside protection while keeping the 2.4% with the stock at expiration in the money (assigned). Assuming a 6% downside protection the stock can decline 8.4% before reaching the Breakeven point..
The 4.5% option will have 0 downside protection for your 4.5% and 4.5% price decline window where your gain or time value proportionately declines to the Breakeven point of 0% net gain.
I would tend to split more in the ITM side with the volatility and experiences I have seen in this market or go all ITM just to guarantee a positive result and not be greedy. I am still trying to just breakeven this year so far compared to my 24% gain last year. It is shaky out there.
Commission effects (minor effects in this case – but interesting calculation anyway to discover the differences):
If you split the Covered call into two contract of $5000 each, your are paying two commissions. Assuming a $50 price a $5.60 entry commission (4.95+0.65) is $0.056 share or 0.112% loss (.056/50) with commission included with a single $500 trade or 2 $5000 trades. Overall loss is still 0.112% with either 1 or 2 trades invested.
With a single $10000 trade of 200 shares at $50, the commission is about half the cost of two trades above. The commission is 6.25 (4.95+1.20) or .03125/sh. Commission loss is there 0.0625% (.03125/50) for the 10000 trade.
With Fidelity, there is a single 4.95 base commission per covered call combination order. With Etrade, there are two 4.95 base commissions charged (1 per leg) so the commission cost is double the above calculations.
Mario
Premium Members,
This week’s Weekly Stock Screen And Watch List has been uploaded to The Blue Collar Investor Premium Member site and is available for download in the “Reports” section. Look for the report dated 04/27/18.
Also, be sure to check out the latest BCI Training Videos and “Ask Alan” segments. You can view them at The Blue Collar YouTube Channel. For your convenience, the link to the BCI YouTube Channel is:
http://www.youtube.com/user/BlueCollarInvestor
Since we are in Earnings Season, be sure to read Alan’s article,”Constructing Your Covered Call Portfolio During Earnings Season”. You can access it at:
https://www.thebluecollarinvestor.com/constructing-your-covered-call-portfolio-during-earnings-season/
Best,
Barry and The BCI Team
barry@thebluecollarinvestor.com
Alan
Thank you so much for your recent response to my question. You explained it much better than the Fidelity customer service representative.
Learning to trade covered calls is absolutely so much fun. Of course I am trading weekly covered calls on AMAZON stock, so the challenge of dealing with both the cost of the underlying and the level of volatility with the recent giant up and down swings in price have kept me on my toes. But the premiums on the sold calls, even when I stay under 18 Delta strikes can give me goose bumps. In it for 6 weeks now and made enough to pay all 2018 taxes and two mortgage payments, plus I still own my shares.
Received your Encyclopedia of Covered Calls book for Christmas and it has helped get me started. I am trying to convince Fidelity to let me trade Poor Man’s Covered Calls
next. I don’t think you have a book out on that strategy though.
Thanks again,
Susan.
Susan,
Yes, I struggled with Fidelity to get approved for an update in level, but it was mostly an application problem which required me to resubmit it. I had to mail my requests in.
I was able to update my accounts at Fidelity as follows as long as you pick Most Aggressive as your investment objective.
IRA: Level B – Purchases of Put and Calls (equity and index) and Purchases of Long Straddles and Strangles
Individual account: Level C – Equity and Index Spreads and Covered put writing
You can do a lot of upgrades online now whereas before I had to mail it in. If there is a problem with the application, you do not get a reply immediately so you have to check on the status yourself and find out it was rejected for some reason you can correct. That was my main problem.
For the individual account, I I am not using the margin at all and do not intend to use it. Just wanted the capability to do a spread in the future (which requires margin approval) which involves buying a call (put) and selling a call (put) with no underlying position.
For the Poor Man PMCC, you just need Level B to be able to buy Long Term Calls but you must pick Most aggressive for your investment objective.
****
General information on trading levels:
Etrade and Fidelity handle trading levels differently. Interesting to compare them.
* Fidelity has 5 levels: A-E
* Etrade has 4 levels; 1-4
Covered Calls:
Levels 1 and A are identical (covered calls) (no margin required) (purchase underlying, sell short calls)
Adding Purchasing (long) Calls and Puts, Long Straddles and Strangles/Combinations:
Levels B at Fidelity does not include covered put writing (short stock) whereas Etrade level 2 includes covered put writing (no margin required)
Adding Spreads:
Levels C and 3 both add spreads. . Fidelity’s Level 3 adds covered put writing while Etrade already included it in Level 2. Level 3 of Etrade allow naked put writing while Fidelity does not allow it. Margin approval is required. Naked put writing is probably allowed at Etrade because there is limited risk (stock price goes to zero) compared to naked call writing.
Adding Uncovered positions:
Levels D and 4 add uncovered naked positions (uncovered shot calls and puts), but there is a difference. Fidelity do not allow uncovered writing of Index Options.
Adding Index Options:
Fidelity’s extra level 5 allow writing of uncovered (naked) index options.
Interesting how when you start learning about options all these differences are truly overwhelming. Took me some time to take it all in and make sense. That’s why covered calls is a first step.
******
Mario
Susan,
Take your time mastering the PMCC strategy before implementing it. Like all strategies, there are pros and cons and lots of moving parts that must be understood and incorporated into the strategy. Our new book, “Covered Call Writing Alternative Strategies” will be available very soon. One third of the book is dedicated to the PMCC.
CLICK ON IMAGE TO ENLARGE & USE THE BACK ARROW TO RETURN TO BLOG
Alan
Allan,
I apologize for bothering you again with another question but the following is crucial to my buy decisions and I need some help, especially with question 2.
I am a premium club member and receive the weekly stock screen and watch list. Assume expiration Friday is 5/18/18 and that date has been reached. . Per BCI methodology I am evaluating the stocks I have in my portfolio which are trading at or above my sold call strike price for exit strategy alternatives – roll out, roll out and up or take no action, . Per the BCI method I have determined no upcoming ER report in the next contract report and I have calculated ROO for roll out and roll out and up and determined both scenarios would meet my 2%-4% goal.
On or near expiration Friday in addition to the above considerations you advise to look at the overall market and the individual stocks technical indicators. Because the weekly watch list comes out post expiration Friday, I need to make this determination without the benefit of the BC weekly watch list. .
Question 1. I get a sense of the overall market view by looking at the S&P 500 and VIX chart. I notice in the Weekly Screen weekly summary you also look at IBD summary, GMI summary, Put/Call Ratio. Would you suggest I track down the same factors. If so do I have to subscribe to IBD just to get the summary and how do I locate the S&P put/call ratio?
Question 2. In analyzing the stock technical indicators I assume I should look at the same ones you refer to in your chapter on exit strategies in your book- moving averages, MACD and Histogram, and Stochastic indicator. Could you briefly give some direction how to locate these charts and how to evaluate them.
.
Thank you,
Kirt
Kirt,
For your question #1, re: Put/Call Ratio on the IBD website:
You can access the Put/Call Ratio on the IBDcsubscriber website via –
–> Market Trends Tab (upper left on the home screen)
–> Psychological Market Indicators on the drop-down menu
–> Put/Call Ratio
Per IBD…”A contrarian sentiment indicator that helps determine major and short-term market bottoms. The Put/Call Volume Ratio compares the total number of puts traded each day with the total number of calls. The ratio will surge above 1.0 when investors turn bearish and buy more puts than calls. A reading above 1.15 can confirm a positive reversal in the S&P 500 or Nasdaq, or follow-through day.”…
Per your question #2, re: …stock technical indicators”…
You can set up your chart(s) using the free version of http://www.stockcharts.com. The details of how to set up the chart can be found in the following blog articles:
https://www.thebluecollarinvestor.com/setting-up-a-technical-chart-an- example-of-an-ideal-chart/
https://www.thebluecollarinvestor.com/the-stochastic-oscillator-a-momentum- technical-indicator/
https://www.thebluecollarinvestor.com/why-use-technical-analysis-an- example-of-a-complete-technical-breakdown/
https://www.thebluecollarinvestor.com/macd-histogram-a-lagging-and- momentum-technical-indicator-part-ii/
https://www.thebluecollarinvestor.com/technical-analysis-indicators-for-long- and-short-term-portfolios-webinar-registration/
https://www.thebluecollarinvestor.com/technical-analysis-how-to-use-volume -in-our-covered-call-decisions/
https://www.thebluecollarinvestor.com/support-and-resistance-technical- analysis-for-covered-call-writing/
https://www.thebluecollarinvestor.com/moving-averages-and-our-covered- call-selections/
https://www.thebluecollarinvestor.com/volume-a-critical-technical-analysis- indicator/
https://www.thebluecollarinvestor.com/combining-technical-analysis-and- market-assessment-to-determine-strike-selection/
The above articles will give you the information that you are looking for. You can also review chapter 4 in Alan’s “Complete Encyclopedia for Covered Call Writing” as well as appendencies V, X, XI, and XII.
Best,
Barry
Alan,
Are there Blue Collar Investor seminars?
Thanks,
Michael
Michael,
Absolutely. Check the “events” link on the blog page of our web site (right side…scroll down):
https://www.thebluecollarinvestor.com/events/
Alan
Alan,
When Rolling the short call in a PMCC are you required to adhere to the same rules you apply when initially structuring the trade, namely that the difference in the strikes plus the short premium must be greater than the cost of the LEAPS, and also that the EV of the short call must be greater than that of the LEAPS?
By the way, I have absent from the fold for a couple a years pursuing other options pipe-dreams. The only thing I’ve learned is that there are no other option strategies that are as dependable as those that you and your BCI team advocate. And there is no better educator on all this option stuff than you.
Regards, Ira
Ira,
Thank you for your very generous comments. You made my day!
The guidelines you are describing for the PMCC are for initial structuring of the trade so that if share price accelerates and we are forced to close both legs of the trade as options trade at or near parity (all intrinsic value), we will close at a profit.
Once the trade is entered, rolling the short call follows the same guidelines as those for traditional covered call writing. One additional caveat is that for the PMCC, rolling up in the same contract month is permissible whereas that strategy is to be avoided for traditional covered call writing.
These and other aspects to the PMCC are detailed in our upcoming book, “Covered Call Writing Alternative Strategies”
Alan
Premium Members,
The Weekly Report has been revised and uploaded to the Premium Member website. Look for the report dated 04/27/18-RevA.
The reason for the update is that we have received updated Risk/Reward data. It is important to note that the update did not change the outcome of any of the stocks in the report.
Best,
Barry
Hey friends,
What an odd market day? Against a backdrop of generally positive earnings and a benign Fed statement DIA, SPY, QQQ, TLT and GLD all went down. That seems to be happening a lot lately. Certainly no time to run for the hills but clearly a time when covered call writing shows it’s value.
I blame the rising dollar, trade war chatter, inflation worry, interest rate creep and slow downs in many economies globally. And I doubt any of that goes away soon.
In the US our unstable political situation in a mid term election year when seasonality is the worst in the 4 year election cycle anyway is no help either.
So from my fox hole it is over write things you plan to keep, don’t do stretch buys on higher beta things, remember cash is an asset class too and the old sports adage: “Defense Wins Championships” ! – Jay
Jay,
Yes, volatile market. 300 down ends up then up. Opposite of yesterday 5/2.
I completed the option leg yesterday on several Wait and sell investments (Buy Stock, Sell STO later at a peak price). I did not want to wait later into the cycle if the Gain was Ok, picking up valuable Time Value before it decays.
4 Account Portfolio:
SPLK Stock 100.66 purcuhased 4/24. 5/2 Added Option leg Strike 104 (OTM) Gain at 103.8 Gain net 6.1% (2 positions in 2 accounts)
HQY: Purchased 4/30 at 65.73. 5/2 added option leg at U= 66.9 Gain net = 3.12%
Still holding long position with OIH (Oil Services ETF). Waiting for a peak to at least breakeven with a rolling down position. Was close the other day but missed it.
***********
ETF Trust Account:
KBE ETF S&P Bank 47.99 purchased 12/17/18. Rolled and held for recovery. added Option let 5/2/18 strike 48 U=48.51 (ITM) Gain 5.85% $842.70. I rolled down last month this ETF, then bought it back at a bargain at a dip. Then held long. Still at 47.77 today but I bet you the day before expiration it will dive if my “casino luck” repeats itself.
XLK (Technology sector) purchased 4/24 64.72. 4/30 option leg at 66.36 Gain 4.22%
EWT – Also purchased on 4/24 at 35.845. Now at 35.74. Notice ITM at 35 at 1.11% . OTM at Strike 36 at 1.8% if exercised . Probably will add that tomorrow.
My ETF Joint Trust account has been net flat for the year when I opened the account as an alternative to a CD earning 1-1.6%. Several of the Run List pick just tanked on me repeatedly. Plus I traded some stocks violating my trading plan, which went south as well (also from the run list) I am happy as long it is not in the red and / or r close to the CD rate till I win win with this account.
Long positions:
Picked up CAT Caterpillar at a bargain price when market as down 300 at 140.23 yesterday 5/3. End of day it was at 143.78 (2.5% gain). Plan to unwind today 5/4 at 145.37 at resistance for a one day 3.6% (3 accounts). That will free up cash for other opportunities.
Settlement date:
Settlement day is now 2 days before selling and buying the same position. Fidelity told me they may impose a 90 day restriction is a trading violation occurs. Have any had experience in this area with a trading violation. Any stories to tell?
Net Portfolio performance:
My 4 account portfolio performance from 1/1/18 to 5/3/18 is down 4.8%. Recovering slowly.
Lessons learned:
The Buy and Wait strategy that Jay espouses seems to work well in this volatile market if you can monitor the price swings during the day. The same with opportunities to enter the trade on a dip in the market to set up a low cost basis, then wait for a peak in the first 2 weeks (or early week 3) of a cycle to add the option leg. If no peak, complete the covered call to gain additional income while you still have time value.
If a stock is relatively stable, set up the covered call immediately to maximize the time value.
Mario
Good morning Mario,
Some years ago I was put in “Trading Jail” for 90 days by Schwab!
During that time I could only use settled funds for new buys and while I could sell at any time I could not buy anything new until that sale settled. Apparently I had a couple instances where I traded too frequently using unsettled funds when I had no other settled funds available and the Trade Police pulled me over! I don’t drive as fast anymore :).
Thanks for your always informative and instructive trading report and your mention of my “Buy and Wait” approach. A caveat I will add to that is I do not turn my portfolio over as often as many traditional covered call writers nor do I try to maximize each expiry month from a covered call standpoint. So I have time to wait and don’t feel the pressure of the Theta clock ticking down at any point in time.
I consider myself a portfolio over writer so if a remain uncovered in bullish times or need to use weeklies to construct 4 or 5 week expirations to overwrite a bounce or an approaching resistance level that is what I do. And If I want to add a new position or add to an existing one I don’t buy it out right if it has good options volume. I sell a cash secured put OTM on a down day so that I am paid to wait for a better entry.
I have kicked myself many times for not buying outright when something takes off just as I have when covered and something takes off :)! It just seems to me that the more we can replace emotion with patience and a system – whatever that system may be so long as it fits our temperament and risk tolerance – the better we will do over time. – Jay
Premium members:
This week’s 8-page report of top-performing ETFs and analysis of ALL Select Sector Components has been uploaded to your premium site. The report also lists Top-performing ETFs with Weekly options as well as the implied volatility of all eligible candidates.
New members check out the video user guide located above the recent reports.
For your convenience, here is the link to login to the premium site:
https://www.thebluecollarinvestor.com/member/login.php
NOT A PREMIUM MEMBER? Check out this link:
https://www.thebluecollarinvestor.com/membership.shtml
Alan and the BCI team
Alan,
I would like to know how you select the strike price associated with the selling of the option. I did find an example in your book that said to use the strike price that is just higher than the next highest strike price. For example, if the strike prices are $20; $25, $30, $35 etc. and the closing price of the stock is $24 then, I would sell the $25 call- not $30 or above.
Also, presently there are around 15-20 companies in the “Passed previous weeks & Passed current week.” categories Would you sell multiple contracts (in the white section) of the same company within this group, as opposed to selling the one of the “Passed Previous Week & Failed Current Week”.
Thanks very much for your assistance.
Jim
Jim,
There are several important topics covered in your questions:
Premium Stock report: New positions are selected from the “white cells” in the report. These are the stocks that are currently eligible.
Diversification of underlyings: Our guideline is at least 5 different stocks in 5 different industries when using individual stocks (less when using exchange-traded funds).
Diversification of strike prices: If selling multiple contracts using the same stock, we can “ladder” strikes…some in-the-money (ITM), some out-of-the-money (OTM) depending on market assessment, chart techicals and personal risk-tolerance. For example, if selling 5 contracts of stock BCI, and we are slightly bullish, we can sell 3 OTM and 2 ITM.
Strike selection: First, set a target initial time value return (say 2 – 4%). Then select ITM or OTM depending on the above factors. See this article I published a few years ago:
https://www.thebluecollarinvestor.com/selecting-a-specific-strike-price-for-our-covered-call-positions/
Alan
Let’s say I have 20 000 to start, is normal to think that I will need to focus on 20$ to 45$ stock’s if I want to use your strategy? if I want to allocate 20% by position.
What about the liquidity of those stock’s?
Francois,
An excellent approach to covered call writing with $20,000 cash available would be to consider exchange-traded funds (ETFs) which offer instant diversification and allows us to use fewer securities. Here is a link to an article I published on this topic:
https://www.thebluecollarinvestor.com/exchange-traded-funds-funding-option-selling-portfolios-with-etfs/
Alan
I have started to use a late collar strategy (I call it mid-contract profit lock-in) as an alternative to the mid-contract unwind in certain cases where the bid-ask spread on the in-the-money option becomes too wide to create a favorable exit.
I have noticed that the bid-ask spread on the put at the same strike price as a way in-the-money call will often be much less wide than the bid-ask spread on the in-the-money call. This offers an alternate way to lock-in profits by purchasing the put in cases where the mid-contract unwind cannot be accomplished at a favorable price.
It is best used for the following circumstances:
1. The stock has earnings next month so you are looking to have it called away and will not be able to use a roll out or roll out and up at expiration anyways.
2. The stock has increased sharply but is still at risk to reverse back down ( high beta stocks ).
3. You want to completely eliminate risk in the position ( say you are on vacation and won’t be able to effectively monitor and manage any position adjustments ).
4. The stock is problematic for legging out of the position, and a combined stock-option order will not execute at a favorable price.
I have noticed a few situations recently where this strategy could be effectively used to lock in profits and prevent losses ( example I had ENTG 35 call strike in the April expiration cycle ).