Strike price selection is one of the 3-required skills when selling covered calls or cash-secured puts. This article will highlight the choices and rationale for our decisions when selling puts for World Wrestling Entertainment, Inc. (NYSE: WWE) on 9/24/2018.
Bullish price chart for WWE

WWE: Bullish Moving Averages
Option-selling lowers our cost-basis and therefore we make money as long as share value does not decline significantly. Bullish technical charts like this one for WWE as of 9/24/2018 is precisely what we are looking for in our put-selling portfolios.
Option chain for WWE
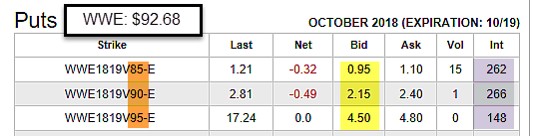
WWE Option Chain on 9/24/2018
With WWE trading at $92.68 on 9/24/2018, we will evaluate the $85.00 (out0f-the-money), $90.00 (out-of-the-money) and $95.00 (in-the-money) strikes (brown field). All 3 choices have adequate open interest of 100 contracts or more (purple field). The published “bid” prices are found in the yellow field:
- $85.00 strike: $0.95
- $90.00 strike: $2.15
- $95.00 strike: $4.50
***We may be able to generate higher bid premiums by leveraging the Show or Fill Rule. See pages 225 – 227 of The Complete Encyclopedia for Covered Call Writing- classic edition for more information on “negotiating” with market-makers.
Let’s now feed this information into the 3-column version of the BCI Put Calculator (free to premium members; single column available for free on this site…expanded version available in the BCI store).
WWE calculations
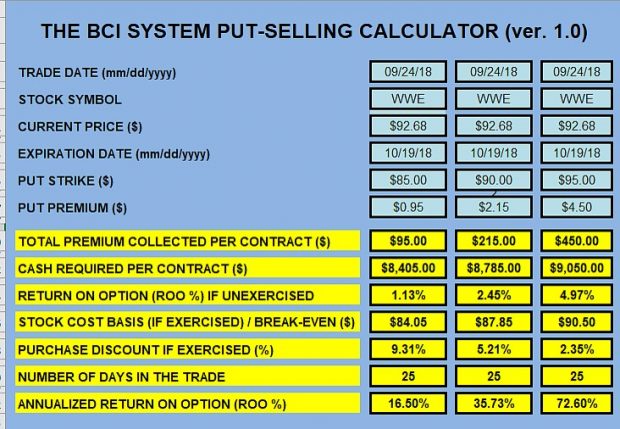
WWE: Calculations
$85.00 strike
- Lowest risk of exercise
- Requires the lowest amount of capital outlay ($8405.00)
- Unexercised return is 1.13%; 16.50% annualized
- 9.31% discount, if exercised
- Lowest breakeven at $84.05
$90.00 strike
- Moderate risk of exercise
- Requires $8785.00 of capital outlay
- Unexercised return is 2.45%; 35.73% annualized
- 5.21% discount, if exercised
- Lowers breakeven to $87.85
$95.00 strike
- Greatest risk of exercise
- Requires the highest amount of cash outlay ($9050.00)
- Unexercised return (stock must move above the $95.00 strike) is the highest at 4.97%; 72.60% annualized
- 2.35% discount, if exercised (lowest of the 3 choices)
- Breakeven is lowered to $90.50, the highest price point of the 3 strikes
Discussion
Strike price selection when selling puts is based on overall market assessment, chart technicals, initial time value return goals and personal risk tolerance. The $85.00 strike offers the greatest amount of downside protection but the lowest unexercised return. The $90.00 strike offers an excellent 25-day unexercised return of 2.45% and lowers the breakeven by 5.21%. The $90.00 strike offers the greatest unexercised return if share price moves above the strike but also presents the greatest risk of exercise. When it comes to puts, most investors do not want to take possession of the stock (there are exceptions as when selling puts instead of setting limit orders), so we will generally favor out-of-the-money puts. From there, we allow of return goals to dictate. For me, I require a range of 2% to 4% for initial time value returns. This would lead me to favor the $90.00 strike. More aggressive investors may opt for the $95.00 strike and more defensive investors may look to the $85.00 strike. All are the correct choices as long as they align with system criteria including meeting time value return goals and personal risk-tolerance.
March 8th stock report
*** PLEASE NOTE: The stock report for the week ending March 8th will be published on Monday March 11th, later than usual, due to vacation and travel plans. Every effort will be made to post this report as early as possible.
Upcoming events
-March 29th
Quinnipiac GAME Forum
International forum for college and graduate school finance majors
-May 8th
Alan will be hosting a free webinar for the Options Industry Council (OIC) on generating income from selling options. More information to follow.
-May 13th
All Stars of Options
Bally’s Hotel, Las Vegas
10 AM – 10:45 AM
How to Select the Best Options in Bull and Bear Markets
Free event
-May 14th
Las Vegas Money Show
Bally’s/ Paris Hotel
12:15 – 3:15
Master class encompassing covered call writing, put-selling and the stock repair strategy
This is a paid event hosted by The Money Show
Your generous testimonials
Over the years, the BCI community has been incredibly gracious by sending our BCI team email testimonials sharing stories as to what our educational content has meant to their families. Moving forward, we have decided to share some of these testimonials in our blog articles. We will never use a last name unless given permission:
Alan,
Your weekly blog articles and library have been a wealth of information I look forward to with each week’s new edition.
Thanks for providing this feature.
Jim W
Market tone
This week’s economic news of importance:
- Construction spending Dec. -0.6% (-0.3% expected)
- Markit services PMI Feb. 56.0 (56.2 last)
- New home sales Dec. 621,000 (600,000 expected)
- ISM nonmanufacturing index Feb. 59.7% (57.5% expected)
- Federal budget Jan. $9 billion ($49 billion last)
- ADP employment Feb. 183,000 (300,000 last)
- Trade balance Dec. -59.8 billion (-$58.0 billion expected)
- Weekly jobless claims 3/2 223,000 (225,000 expected)
- Productivity Q4 1.9% (1.8% expected)
- Consumer credit Jan. $17 billion ($15 billion last)
- Nonfarm payrolls Feb. 20,000 (175,000 expected)
- Unemployment rate Feb. 3.8% (as expected)
- Average hourly earnings Feb. o.4% (0.3% expected)
- Housing starts Jan. 1.230 million (1.212 million expected)
- Building permits Jan. 1.345 million (1.326 million last)
THE WEEK AHEAD
Mon March 11th
- Retail sales Jan.
- Business inventories Dec.
Tue March 12th
- NFIB small business index Feb.
- Consumer price index Feb.
Wed March 13th
- Durable goods orders Jan.
- Producer price index Feb.
Thu March 14th
- Weekly jobless claims 3/9
- New home sales Jan.
Fri March 15th
- Empire state manufacturing index March
- Industrial production Feb.
- Job openings Jan.
- Consumer sentiment March
For the week, the S&P 500 moved down 2.16% for a year-to-date return of 9.42%
Summary
IBD: Market in confirmed uptrend
GMI: 4/6- Bullish signal since market close of January 31, 2019
BCI: I am favoring out-of-the-money strikes 3-to-2 compared to in-the-money strikes for new positions.
WHAT THE BROAD MARKET INDICATORS (S&P 500 AND VIX) ARE TELLING US
The 6-month charts point to a slight turndown this week. In the past six months, the S&P 500 down 5% while the VIX (16.05) moved up by 14%.
Wishing you the best in investing,
Alan and the BCI team


Hello Alan,
I’m diving into your ebooks. And as I thought after watching your YouTube videos, I’m in love with Covered Calls and your system.
You have done an excellent job explaining and mapping out your thoughts behind your system and each step. Thank you!
I do have one question regarding using a margin account. Do you recommend using margins with your system? Why or why not.
Thank you again,
Anthony
Anthony,
Welcome to our BCI community.
Option trading can be added to cash, margin and IRA accounts by filling out certain broker forms. Covered call writing requires the lowest level of option trading approval because it is considered low-risk and intuitive for most retail investors. Margin accounts allow investors to borrow money from the broker which, in turn, can enhance gains. But this leverage works in both directions and can also exacerbate losses. Margin maintenance is another factor that can be a liability.
In my humble opinion, most retail investors should focus in on cash or IRA accounts, the latter (when available) being the best choice since we are generating a constant stream of short-term capital gains.
Margin accounts may be appropriate for experienced, sophisticated stock/option investors.
Thanks for your generous remarks.
Alan
Alan,
Isn’t it true that when selling cash secured puts that you buy back the put when it is 20% of the value originally or 10% depending on where you are in the option lifespan of that option?
Joanna
Joanna,
Yes. In the BCI methodology for put-selling, we close the short put position when the price of the underlying rises significantly causing the put premium to decline to a value 20% or 10% of the original premium value, depending on the time to expiration. This will allow us to generate a 2nd income stream in the same contract month with the same cash investment.
See pages 141 – 143 of my book, “Selling Cash-Secured Puts” for detailed information on this exit strategy.
Alan
Hello again Alan,
I have another question for you and I apologize if this has been addressed earlier in a video or newsletter.
At the time you wrote the Encyclopedia weekly options were just becoming popular. I have been trying to formulate a charting approach to the stock screening process and would appreciate any comments you may have on how to properly evaluate potential stocks for weekly option contracts. I was specifically looking at options two weeks in duration.
As always I appreciate and value your input.
Tim
Tim,
Whether we sell options once a month or twice a month, the technical analysis remains the same…moving averages, momentum indicators and volume analysis. See page 73 of “The Complete Encyclopedia for Covered Call Writing- classic edition” for details on how to set up the technical chart when using the BCI methodology.
The Premium stock and ETF reports highlight those securities that pass all the screens + have Weeklys associated with them.
For those who are not members, securities with Weeklys can be found at this free link:
http://www.cboe.com/products/weeklys-options/available-weeklys
Alan
Alan
Thanks a lot for the information.
One question can I do a naked sales put and
Buy a put to protect the investment in case the market goes down ?
And how can you protect a naked cover call ?
Best regard
Daniel
Daniel,
To protect the sale of the put, some traders will short a stock (borrow and then sell a stock). This is known as a “covered put” It requires a higher level of trading approval from most brokers and is appropriate for experienced, sophisticated investors and not for most retail investors.
If the sale of a call option occurs after the purchase of an appropriate number of shares, it is “covered”, not “naked” Additional protection of this position includes our 20%/10% guidelines regarding buying back our short calls. This can be automated by setting up a “buy-to-close limit order” immediately after establishing our covered call trade. See the exit strategy chapters in both editions of the “Complete Encyclopedia…”
Alan
Hi Alan,
I was reading your CCW_Dividend capture paper and had the following question:
—-
Stock Price Accelerates Significantly Early in the Contract
One of the characteristics of an option is that as the strike price moves deeper in-the-money (share price appreciates), the time value component of the premium approaches zero. When an option is trading at its intrinsic value only, it is known as trading at parity. We can take this knowledge and convert it into cash. Let’s say we bought a stock for $48 and sold the $50, 1-month call for $1.50 or $150/contract. The price of the stock then moves up to $60 in one week…it can happen! We now have maxed our trade generating $150 per contract from option premium and another $200 per contract from share appreciation. This represents a 1-month return of 7.3%. Keep in mind that our shares can only be worth $50 as long as we are bound by our option obligation. We check the value of the $50 call and we see that it is trading @ $10.10, near parity ($10 of intrinsic value and $0.10 of time value). If we close our short options position for $10.10, we can then sell our shares for $60, not our $50 option obligation. This leaves us an options debit of $10.10 and a share credit of $10 or a net debit of $10 per contract. If the cash freed up from the sale of the shares can generate more than $10 (not much of a challenge) why not institute this exit strategy? If our main concerns were dividend capture and tax avoidance, we may not consider this an opportunity.
—–
The question was on the gain of the contract (without commisions):
Initial BUY 48
CCW SELL OPEN @50 for 1.5 premium
So stock went to 60
At time of unload BUY TO CLOSE @ 10.1
Before selling the shares it costed 1.5-10.1= -8.6
Then sale the shares at 60
So the gain would be 60-48 = 12
And taking away the cost of exiting the CC (-8.6)
Or 12-8.6= 3.4
Or 3.4 gain for the entire transaction.
I did not understand the part were the gain is more than 10$. Or may be I messed up the calculation.
Thanks in advance for clearing this.
Mauricio
Mauricio,
The strategy you are alluding to, I have titled “The mid-contract unwind” exit strategy. When share value appreciates significantly, the time value component of the option premium decreases and moves near zero. This is what we must focus in on because the intrinsic value component is neutralized by the increase in share value above the original strike price.
In this case, the cost-to-close the $50.00 call is $10.10 and increase in share value is $10.00 (from $50.00 to $60.00). This means that the TIME VALUE cost-to-close is $0.10 or $10.00 per contract. The strategy makes sense if the can take the cash freed up from the sale of the stock and use it to generate a 2nd income stream in the same month that returns more than $10.00 per contract. That should be easy if this occurred early-to-mid-contract.
See the exit strategy chapters in both editions of “The Complete Encyclopedia” for detailed information on the mid-contract unwind exit strategy.
Alan
Hi Alan,
I have a question about hitting a double. Your system tells us to buy back the option at 10%-20% of its initial value. However, I’ve adapted these guidelines to my own 20%-30% to improve my profits to even higher levels. Here are some of the trades I moved forward with:
On February 14, 2019 I bought shares of GLPG
On February 14, 2019 I sold out-the-money calls with a strike price of 92 euros for 5.20 euros
On February 27, 2019 the price was approximately 85 euros and I bought the options back for 1.35 euros (26% of the initial value)
On March 4, 2019 the price popped back up to that same 90.35 euros
On March 4, 2019 I sold the same options (same strike price) for 2.95 euros
Now, the stock has been moving pretty sideways for quite some time and I often see overbought and oversold situations with plenty of opportunities to hit a double.
Should you proceed with stocks that are moving sideways to benefit from these situations (and increase the chances for hitting a double) or do you always favor stocks that are in a clear uptrend?
Thanks in advance!
Hamish
Hamish,
Congratulations on a great series of trades.
The 20%/10% guidelines are just that…guidelines. I specifically don’t reference them as “rules” That gives us the flexibility to veer slightly from these guidelines depending on our trading style and personal risk-tolerance. Back in the 1990s, I tried various combinations as to when to buy back the option associated with a declining stock and 20/10 rose above the others. Nothing wrong with 30/20 if that works best for you.
It is okay to use a consolidating stock as long as the other technical indicators lean bullish. In our premium member stock reports, consolidating stocks with bullish momentum indicators appear in the white cells as “eligible” Stocks with all bullish indicators will also be highlighted in bold.
Keep up the good work.
Alan
Premium Members,
This week’s Weekly Stock Screen And Watch List has been uploaded to The Blue Collar Investor premium member site and is available for download in the “Reports” section. Look for the report dated 03/08/19.
Also, be sure to check out the latest BCI Training Videos and “Ask Alan” segments. You can view them at The Blue Collar YouTube Channel. For your convenience, the link to the BCI YouTube Channel is:
http://www.youtube.com/user/BlueCollarInvestor
Best,
Barry and The Blue Collar Investor Team
barry@thebluecollarinvestor.com
Just curious if your ITM & OTM definitions are correct in this article? I was under the impression that anything below the stock price was ITM and anything over the stock price is considered OTM. Thanks
Joseph,
You gave the correct definitions for call options but this article relates to put options. The “moneyness” of options for puts is the opposite that of calls.
For a stock trading at $$92.68, the $95.00 strike is out-of-the-money for calls but in-the-money for puts.
See pages 15 – 16 in my book, “Selling Cash-Secured Puts” for more clarity on this topic.
Alan
Thank you for the clarification. (^_-)👍
San Francisco Money Show:
New speaking event just added: August 15 – 17, 2019
Details to follow.
Alan
Alan,
My name is Lucas. I’ve bought two of your books so far from Amazon, “Selling Cash Secured Put Options” and “Complete Encyclopedia of Covered Call Writing”.
After reading both, I’m a little confused. What is the reason you would want to sell cash secured puts? While a good strategy, it almost seems like it’s always a better option to just sell covered calls.
Could you provide me examples of when it would be a better idea to sell cash secured puts versus selling covered calls?
Lucas,
Both are outstanding cash-generating strategies. I favor covered calls but both will work. Put-selling is a wonderful alternative to setting limit orders when looking to “buy a stock at a discount” from current market value.
I use the PCP strategy (Chapter 16 of the put book) in bear market environments, selling deep OTM puts before writing deep ITM calls. Here is a link to an article I wrote on this topic:
https://www.thebluecollarinvestor.com/how-to-generate-10-per-year-in-bear-markets-by-selling-stock-options/
I also suggest you review pages 20 -21 of the put book where I discuss the pros and cons of put-selling.
Alan
New Blue Chip Report now available for premium members:
The Blue Chip report of best-performing Dow 30 stocks has been uploaded to the premium member site in the “resources/downloads” section. One stock was eliminated and two new ones added from last month’s report.
Alan
Good news… ETF XBI
Just Hit a Double on 3/13/19 STO XBI 3 contracts strike 92 @0.55.
The BTC occurred last week on 3/6/19 Strike 92 @ 0.15.
So it does not hurt to keep trying with an open order!
Mario
Mario,
Nice going.
I thought it would be useful for new members to visualize your trades with a chart which highlights the classic V-shaped pattern we see when “hitting a double” (red lines).
This exit strategy netted an additional $40.00 per contract (less commissions) and took probably 3 minutes.
Keep up the good work and thanks for sharing.
CLICK ON IMAGE TO ENLARGE & USE THE BACK ARROW TO RETURN TO BLOG.
Alan
For the Blue Chip Report I see that Boeing is on the list. The price has taken a beating. I see the note “Post-crash price decline”.
Terry,
Yes, I should have added the word “plane” before “crash” for clarity. I added that note because although the price performance was still impressive in the 2 time frames, recent pricing was impacted as a result of the plane crash and review of the safety of the plane involved.
Alan